Executive Summary
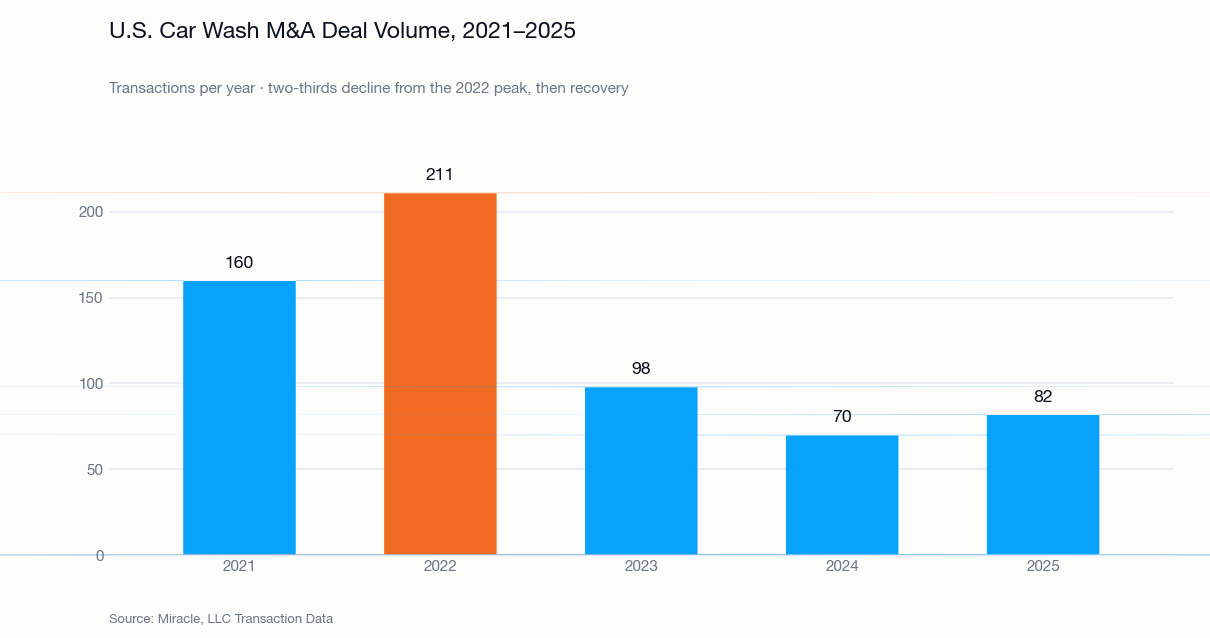
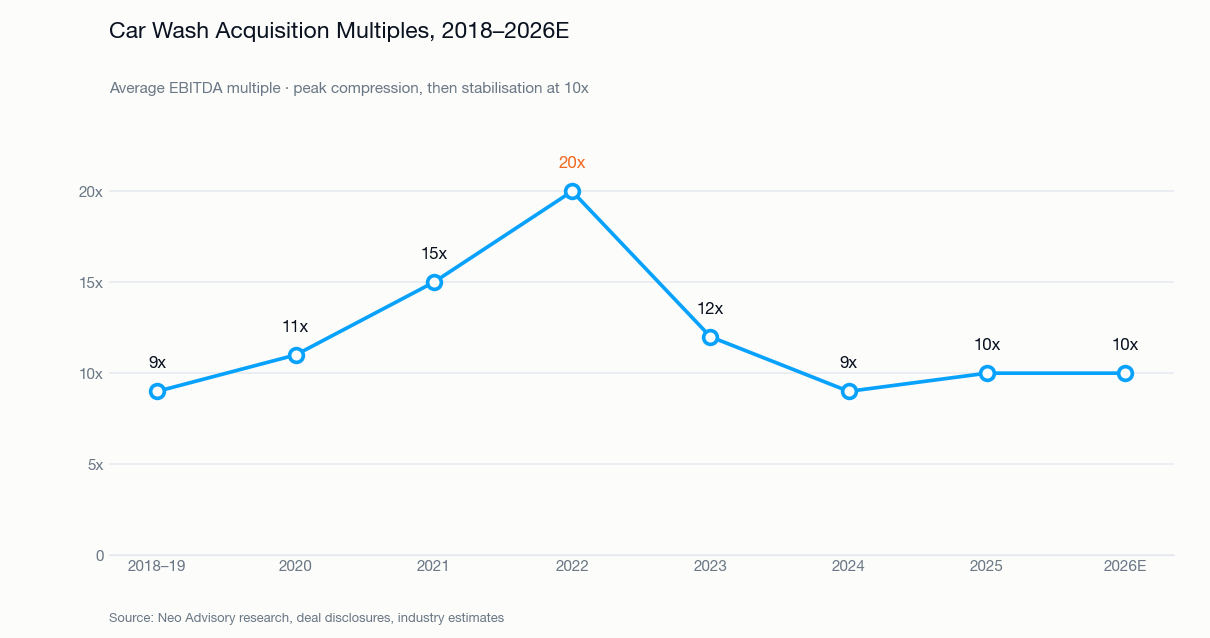
The U.S. car wash sector has completed a full cycle in five years. Between 2019 and 2022 roughly $10 billion of private equity capital entered the industry, deal volume peaked at 211 transactions in 2022, and acquisition multiples reached 20x EBITDA. By 2024 transaction count had fallen to 70 — a two-thirds decline from the peak — multiples had compressed to 9x, and the sector's most aggressive leveraged roll-up had filed for Chapter 11.
That correction is now largely complete, and the market that has emerged is more disciplined and — for a well-positioned seller — more navigable than the boom market ever was.
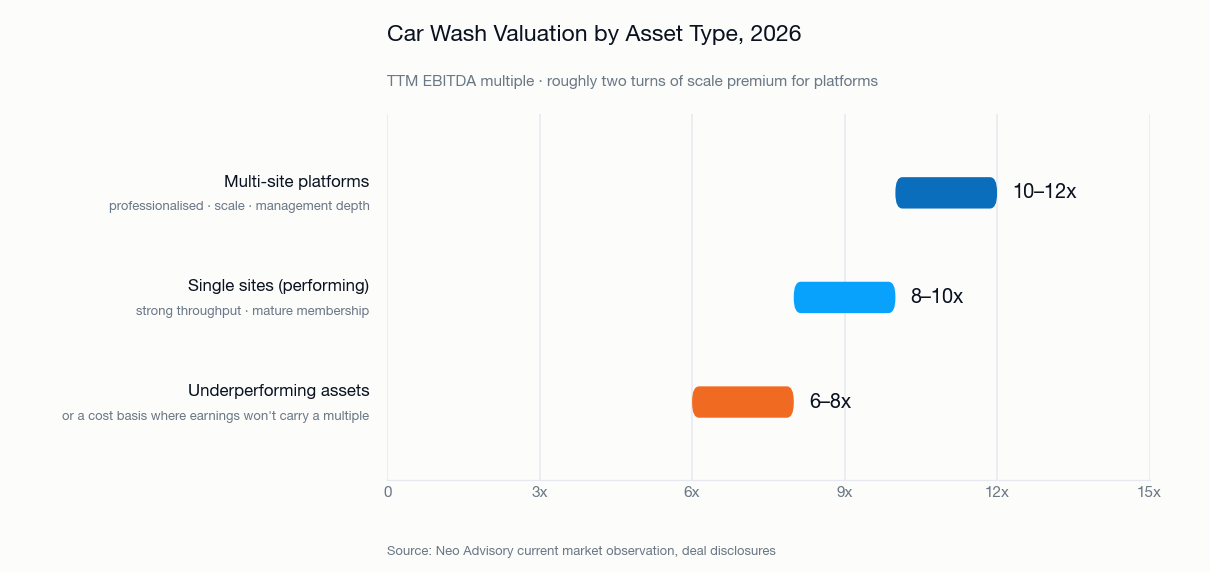
KEY INSIGHT U.S. car wash acquisition multiples compressed from a 2022 peak of approximately 20x EBITDA to 10x by 2025, while annual deal volume fell from 211 transactions in 2022 to 70 in 2024 before recovering to 82 in 2025. The market now prices on scale and evidence: multi-site platforms transact at 10–12x TTM EBITDA, performing single sites at 8–10x, and underperforming assets at 6–8x or on a cost basis. The roughly two-turn premium for platform scale is the clearest arbitrage in the sector.
Three events reset the sector's narrative. Zips Car Wash entered Chapter 11 in February 2025 with $653.9 million of funded debt against $1 million of cash, emerging on 30 April after a $279 million debt reduction with 230 locations (Zips). Leonard Green & Partners agreed to take Mister Car Wash private at $7.00 per share, implying an enterprise value of approximately $3.1 billion, announced 18 February 2026 and pending completion at the time of writing (Mister Car Wash). And Driven Brands exited Take 5 Car Wash entirely, allowing Oaktree's Whistle Express to assemble a 530-site platform.
None of these events reflected a failure of the underlying business model. Professional wash adoption has risen from 50% of U.S. drivers in 1990 to 79% in 2024. Subscription membership revenue grew approximately 15% year-over-year in 2025, with 76% of operators reporting meaningful membership expansion. Express tunnel EBITDA margins of 35–55% — and 65% for the best operators — remain among the most attractive in retail services.
What failed was capital structure, not operations. Zips is the sector's reference case precisely because the business was sound: $303 million of annual revenue, 625,000 members, roughly 24 million cars washed per year. It was the debt stack and fixed rent obligations, engineered for a zero-rate environment, that could not survive.
For an owner of a three-to-twenty site express platform, this is a materially better market to sell into than 2022 was — not because pricing is higher, but because the buyers remaining are disciplined, well-capitalized, and specific about what they want. A seller who can evidence membership quality, throughput and site economics faces a competitive field. A seller who cannot faces a bid-ask gap that has not closed since 2022.
Section 1: Market Size, Growth & Structure
1.1 Market Sizing
Published estimates of the U.S. car wash market vary considerably, driven by genuine definitional differences — geographic scope, whether detailing is included, and whether self-service and in-bay formats are counted alongside express tunnels.
| Research source | 2025–26 estimate | Projected | CAGR | Scope |
|---|---|---|---|---|
| Grand View Research | $15.3B (U.S., 2025) | $17.0B by 2033 | 1.1% | U.S. wash only |
| Mordor Intelligence | $17.3B (N. Am., 2026) | $22.9B by 2031 | 5.73% | North America |
| IBISWorld | $18.7B (incl. detailing) | Slight decline | 1.5% | U.S. incl. detailing |
| Future Market Insights | $17.2B (express, 2025) | $21.5B by 2030 | 4.5% | U.S. express sector |
| Neo Advisory estimate | $15–19B (U.S., 2026) | $17–23B by 2031 | 1.1–5.7% | Calibrated range |
We treat $15–19 billion as the credible U.S. baseline for 2026. For investors evaluating where institutional capital is actually deploying, the North American express tunnel segment — roughly $17 billion growing at 4.5% — is the more relevant benchmark than the total market.
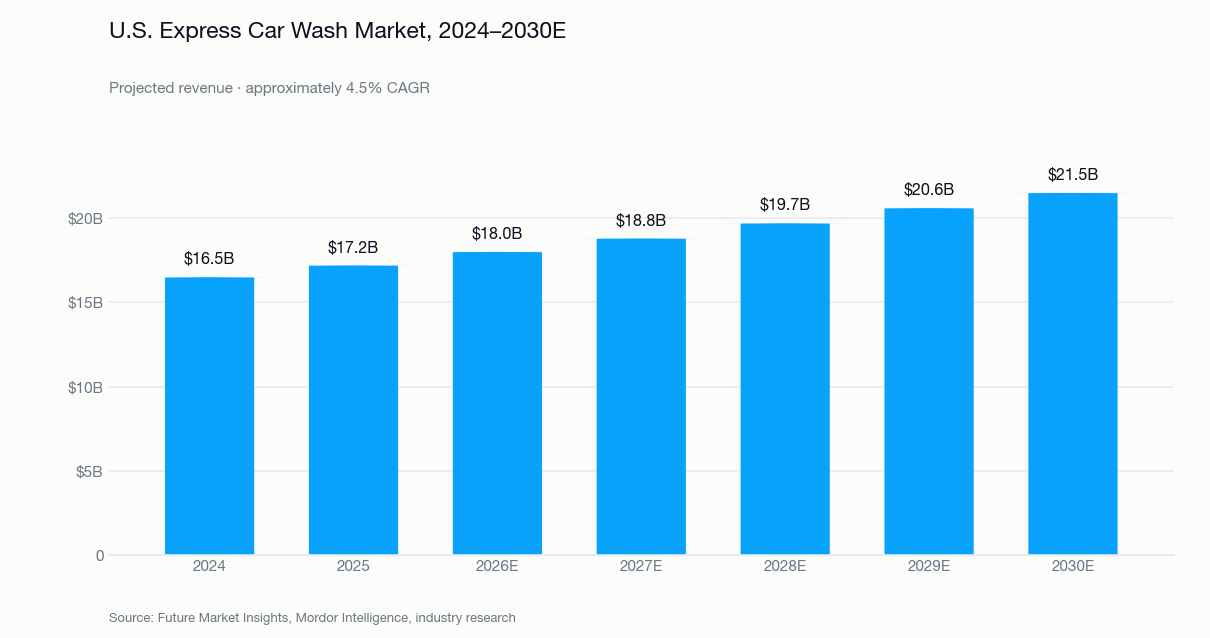
1.2 Express Segment Trajectory
| Year | U.S. express car wash revenue |
|---|---|
| 2024 (actual) | $16.5B |
| 2025 (estimate) | $17.2B |
| 2026E | $18.0B |
| 2027E | $18.8B |
| 2028E | $19.7B |
| 2029E | $20.6B |
| 2030E | $21.5B |
Approximately 4.5% CAGR. Sources: Future Market Insights, Mordor Intelligence, industry research and company disclosures.
1.3 Growth Drivers
Vehicle base and fleet age. Roughly 280 million registered vehicles in the U.S. with an average age near 12 years. Older vehicles are washed more frequently, both for appearance and for resale value preservation.
Structural adoption shift. Professional wash adoption rose from 50% of drivers in 1990 to 79% in 2024 — a 29-point shift over three decades, with further runway remaining.
Subscription economics. Unlimited membership revenue grew approximately 15% year-over-year in 2025, and 76% of operators reported meaningful membership expansion. This is the single most important development in the sector's history from a valuation standpoint, because it converts a weather-dependent transactional business into a contracted recurring-revenue one.
Electric vehicles. Roughly 3.3 million EVs registered nationally, driving demand for touchless and eco-wash formats and creating a premium customer segment.
Regulatory pressure on home washing. Water-use restrictions increasingly disadvantage driveway washing, pushing volume toward professional facilities that reclaim and treat water.
Section 2: Business Models & Financial Profile
2.1 Format Comparison
| Format | Capex (new) | Cars/hour | EBITDA margin | Membership fit | Investor appeal |
|---|---|---|---|---|---|
| Express tunnel | $5–8M | 120–200 | 35–65% | Excellent (40–75% of revenue) | Best-in-class |
| In-bay automatic | $150K–$3.5M | 20–40 | 35–50% | Moderate | Viable |
| Self-service | $150K–$1M | n/a | 40–60%* | Limited | Declining share |
| Full-service | $500K–$5M | 8–25 | 15–30% | Partial | Labor-intensive |
*Self-service margins are high as a percentage of revenue but modest in absolute dollars.
The express tunnel is the only format that supports institutional-scale subscription economics, which is why it has absorbed essentially all of the sector's institutional capital.
2.2 Express Tunnel Unit Economics
| Metric | Range / benchmark | Notes |
|---|---|---|
| New development cost | $5–9 million | Land, construction, equipment; varies by market |
| Acquisition cost (existing) | $5–10M (8–10x TTM EBITDA, single site) | Platforms 10–12x; underperforming assets 6–8x or cost basis / asset based valuation |
| Annual revenue (mature) | $1–3 million per site | Driven by traffic and membership penetration |
| Membership revenue share | 40–75% of total | Up to 80% for top-quartile operators |
| EBITDA margin | 35–55% (top operators 60%) | Net of labor, chemicals, utilities |
| Labor as % of revenue | 17–25% | Express minimizes staffing versus full-service |
| Cash-on-cash return | 15–30% | Well-sited locations with mature membership |
| Payback period | 3–5 years | Assumes 7–8% monthly churn |
| Cap rate (net-leased) | 6.0–6.5% | Passive NNN real estate investors |
| Average member lifetime value | ~$440 | Increases materially with lower churn |
| Monthly member churn | 7–8% benchmark | Best operators achieve 5–6% |
The churn number is the one most owners underestimate and every buyer models explicitly. The difference between 5% and 8% monthly churn, compounded across a membership base, is the difference between a premium multiple and an average one. It is also the single most diligence-tested metric in the sector.
Section 3: Competitive Landscape
The sector remains highly fragmented despite a decade of consolidation. Roughly 70,000 wash locations operate nationally, and the largest operator controls under 1% of sites.
| Platform | Sponsor | Approximate scale |
|---|---|---|
| Mister Car Wash | Leonard Green (take-private, 2026) | ~548 sites nationwide |
| Whistle Express (incl. former Take 5) | Oaktree Capital | 530 sites — largest express platform |
| Express Wash Concepts (EWC / Club Carwash) | Freeman Spogli | 390 sites across 6 states |
| Quick Quack Car Wash | KKR (invested 2024) | 300 sites, Sunbelt-focused |
| Zips (reorganized) | Lender-controlled | ~230 sites |
| Spotless Brands / Splash | AEA Investors | ~200 Northeast sites |
Platform sizes approximate as of Q1 2026. Sources: Neo Advisory research, company disclosures, publicly reported transactions.
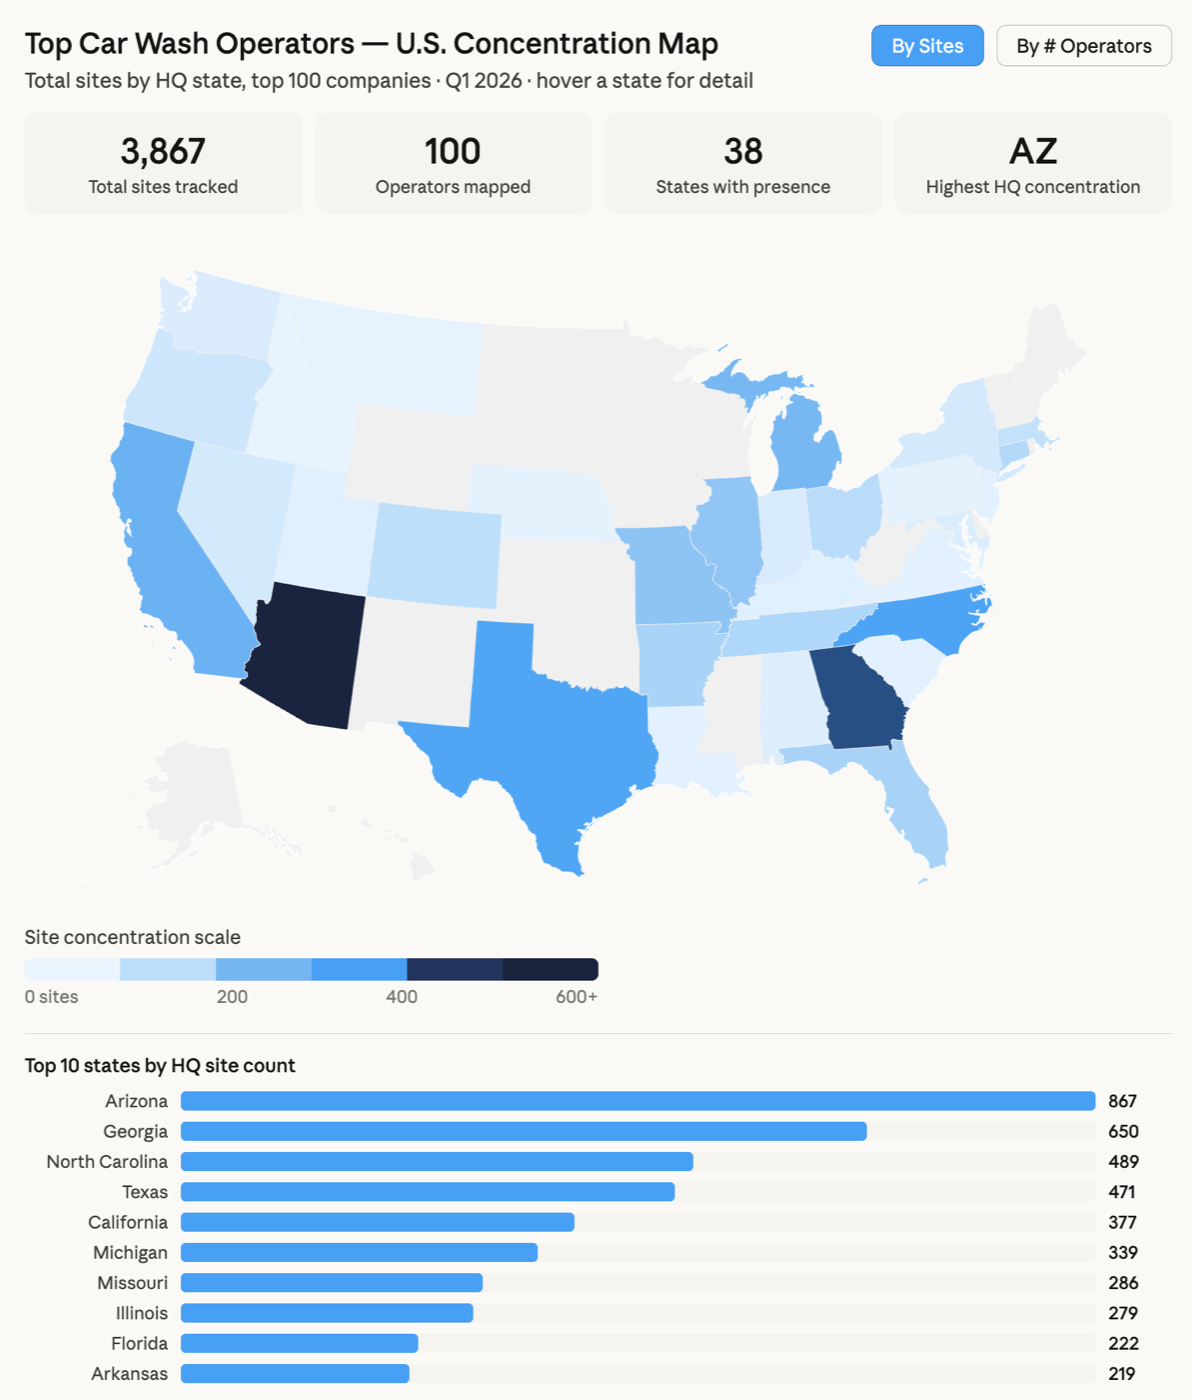
The geographic picture reinforces the fragmentation point. Across the top 100 operators, 3,867 sites are distributed over 38 states — Arizona leads with 867, followed by Georgia at 650, North Carolina at 489 and Texas at 471. No single state is close to consolidated, and the Sunbelt concentration reflects both climate and the development economics of new tunnel construction.
Section 4: M&A Activity & Deal Market Dynamics
Transaction counts throughout this section are drawn from Miracle, LLC Transaction Data. Valuation benchmarks, platform profiles and buyer landscape analysis are Neo Advisory research based on publicly announced transactions, industry reports and operator disclosures through Q1 2026.
4.1 The Cycle in Three Phases
| Phase | Period | Characteristics |
|---|---|---|
| Boom | 2019–2022 | ~$10B PE invested; 211 deals at 2022 peak; 20x multiples; ~900 new sites/year |
| Slowdown | 2023–2024 | Volume fell 98 → 70; valuation gap widened; sponsor-to-sponsor deals rose |
| Stabilization | 2025–2026 | 82 deals in 2025; 200–400 sites/year; 6–10x multiples; ~$1.4T PE dry powder |
4.2 The 2024 Contraction
2024 marked the most significant contraction in car wash M&A since the sector's private equity boom began. Transaction count fell from 98 in 2023 to 70 in 2024, a decline of roughly 29%, following an even sharper drop from the 211-deal peak in 2022. But the headline count understates what happened, because the slowdown was accompanied by a dramatic concentration of activity among a very small number of buyers — a structural shift with important implications for how volume figures should be read.
| Metric | 2023 | 2024 | Change |
|---|---|---|---|
| Transaction count | 98 deals | 70 deals | −29% |
| Most active acquirer | El Car Wash | Whistle Express | Shifted |
| Top acquirer deal share | ~11% | ~43% | Sharp concentration |
| Average multiple | ~12x | ~9x | Compression |
The concentration figure is the one that matters. Whistle Express accounted for roughly 43% of transactions in the period, driven largely by the Take 5 acquisition from Driven Brands. Excluding that single transaction, organic deal activity was substantially lower than the headline count suggests — most PE-backed platforms were in capital preservation and portfolio digestion mode, not acquisition mode.
4.3 Deal Volume and Multiple Trends
| Year | Deal count | Average multiple |
|---|---|---|
| 2021 | 160 | 15x |
| 2022 (peak) | 211 | 20x |
| 2023 | 98 | 12x |
| 2024 | 70 | 9x |
| 2025 | 82 | 10x |
Transaction counts: Miracle, LLC Transaction Data. Multiples from Neo Advisory research and deal disclosures.
4.4 Valuation by Asset Type
Current pricing separates on two axes — scale and evidence — and knowing which band a business sits in is the single most important thing for a seller.
Multi-site platforms — 10 to 12x TTM EBITDA. Professionalized operators with management depth, systems that survive the owner's departure, and geographic density. Buyers here are acquiring an operating platform, not a collection of sites.
Performing single sites — 8 to 10x TTM EBITDA. Strong throughput, mature membership, above-average ARPU and demonstrated same-store growth. These transact competitively, but without the platform premium.
Underperforming assets — 6 to 8x TTM EBITDA, or a cost basis. Weak membership penetration, deferred maintenance, unfavorable lease structures, or traffic below 25,000 vehicles per day. Where earnings will not support a multiple at all, these assets are underwritten on cost — land and improvements less deferred capital expenditure and the cost of bringing the site to standard. Bid-ask gaps here remain wide, largely because sellers are still anchored to 2021–22 peak multiples that are not returning.
The two-turn gap between a performing single site and a platform is the most actionable number in this report. It is a premium for scale and professionalization, not for asset quality — which means it is available to an owner who consolidates, builds management depth, and presents the business as a platform rather than as a set of sites.
A note on sector advisory. Car wash M&A is a genuinely specialist field, and the intermediaries who transact in it consistently are few. Miracle Car Wash Advisors, a leading real estate and M&A advisory firm in the car wash industry with offices in Nashville and Tampa, puts the distinction plainly: "Miracle stands apart from generalist business brokers. We operate in a specialized niche where car wash expertise meets high-level financial advisory."
That framing is correct, and it cuts both ways. The platforms acquiring in this sector underwrite membership cohort retention, tunnel throughput and vehicle counts — not generic small-business metrics. A seller represented by an intermediary who does not model those things is negotiating without the numbers that determine the outcome.
4.5 Selected 2025–26 Consolidation Activity
| Transaction | Date | Acquirer type | Region | Rationale |
|---|---|---|---|---|
| Mister Car Wash → Leonard Green (take-private) | Announced Feb 2026 | Large PE | National | Return to private ownership; removes public market drag |
| Take 5 Car Wash → Whistle Express (Oaktree) | Feb 2025 | Large PE | National | Driven Brands full exit; creates 530-site platform |
| Splash Car Wash → AEA Investors | Apr 2025 | Mid PE | Northeast | Sponsor-to-sponsor; 65 sites; Northeast density |
| Spotless Brands acquires Pete's Express | Nov 2025 | PE platform | Northeast | Accelerates AEA-backed Northeast expansion |
| ClearWater Express / BlueWave | Dec 2025 | Strategic | Texas | Largest private express operator in Texas |
| Club Car Wash acquires Express Car Wash Colorado | May 2025 | PE platform | Colorado | Multiple competing bids; strong membership base |
| EWC acquires Royalton Car Wash | Sep 2025 | PE platform | Ohio | EWC reaches 124 sites across 6 states |
| LUV Car Wash acquires Future Express | Apr 2025 | Regional | California | Northern California densification |
| Zips Car Wash Chapter 11 | Feb–Apr 2025 | Restructuring | National | $653.9M debt; emerged 30 April; 230 sites retained |
Deal values generally undisclosed for private transactions.
4.6 Case Study: Zips Car Wash and the Anatomy of a Leveraged Roll-Up Failure
Zips filed Chapter 11 on 5 February 2025 with $653.9 million of funded debt, $1 million of cash, and senior secured term loans that had matured five weeks earlier. At filing the business operated 260 locations across 23 states, generating $303 million of annual revenue and serving 625,000 Unlimited Wash Club members — approximately 24 million cars washed per year.
The failure was not operational. The underlying business was sound. The failure was structural.
Four factors compounded:
- Private equity acquisition in 2020 followed by aggressive leveraged roll-up — 40 acquisitions over five years, growing from 130 to 260 locations.
- An aggressive sale-leaseback strategy that generated short-term liquidity while creating permanent fixed rent obligations exceeding long-term operational flexibility.
- Sites acquired at peak 2021–22 multiples, financed on assumptions of a sustained low-rate environment.
- A capital structure fundamentally mismatched to actual unit economics — evidenced by the $279 million of debt reduction required to right-size it.
The plan was confirmed on 18 April 2025 and Zips emerged on 30 April under lender control, with approximately 230 sites, $375 million of take-back debt and a new $15 million revolving facility (Zips).
Our founder examined this failure at the time of filing in Washing Away Debt: Zips Car Wash and the Cost of Private Equity Ambition, published April 2025. The central finding there still holds: a debt load exceeding $650 million implied an average interest rate of roughly 14% in 2023 — an exceptional burden for a business dependent on consistent cash flows. That analysis also identified two compounding failures beyond the debt itself: an inability to raise prices in an oversaturated local market, and expansion that intensified competitive pressure rather than building durable advantage.
The wider lesson drawn there applies to any operator evaluating an acquisition today: "Potential, while enticing, often hinges on untested assumptions like market shifts, your ability to fix inefficiencies, or future growth that may never materialize."
The lesson generalizes well beyond Zips. Sale-leaseback proceeds are not free capital — they convert a flexible asset into a fixed obligation. Any operator contemplating an aggressive sale-leaseback strategy should model the rent obligation against a downside revenue case, not a base case.
4.7 Mister Car Wash: What the Take-Private Signals
Leonard Green agreed to take Mister Car Wash private at $7.00 per share, implying approximately $3.1 billion enterprise value, announced 18 February 2026 (Mister Car Wash). LGP had been a shareholder since 2014 and held roughly 67% of the stock before the transaction.
| Factor | Public market reality | Private market advantage |
|---|---|---|
| Earnings scrutiny | Quarterly same-store sales and EPS pressure | 3–5 year value creation plans without quarterly optics |
| Valuation | IPO at ~25x EBITDA (Jun 2021), compressed to ~7–8x by 2025; stock fell more than 70% | Intrinsic value realization independent of public sentiment |
| Capital structure | Public markets constrained recapitalization | Sponsors can refinance and restructure freely |
The sector implication is that the public comparable which had been dragging private valuations downward is now gone. Private benchmarks may reset upward as a result — and any subsequent regional divestitures from the Mister portfolio would create acquisition opportunities for mid-market platforms.
4.8 The Buyer Landscape
| Tier | Firms | Platforms |
|---|---|---|
| Market leaders | Leonard Green, Oaktree, KKR | Mister, Whistle Express, Quick Quack |
| Mid-market | AEA Investors, Freeman Spogli, Wildcat Capital, CCMP Growth | Spotless/Splash, EWC/Club Carwash |
| Emerging | TRP Capital, ClearSky Capital, Point72/Tsunami | Jax Kar Wash, Raceway Express, Illinois cluster |
The important development is the third tier. Mid-market and emerging firms are now actively competing for regional acquisitions in the 5–30 site range — a dynamic that did not exist during the peak roll-up cycle, when a handful of mega-platforms set pricing. For a seller in that size band, buyer competition is meaningfully better than the headline multiple compression suggests.
4.9 What Buyers Prioritize
| Buyer type | Primary priority | Typical structure | Multiple range |
|---|---|---|---|
| Large PE platform | Densification in existing markets | All-cash, quick close, minimal seller involvement | 8–12x |
| Mid-market PE | Platform scale; regional leaders with 5–20 sites | Flexible; equity rollover common | 7–11x |
| Emerging PE | Dominance in a specific metro or state | Creative structures; accepts integration complexity | 5–9x |
| Strategic / independent | Geographic contiguity; relationship-driven | Operator-friendly; often direct outreach | 6–10x |
| NNN real estate | Passive income; 15–20 year lease terms | Cap-rate focused; no operational involvement | 6.0–6.5% cap |
Section 5: Principal Risks
| Risk | Severity | Description | Mitigation |
|---|---|---|---|
| Capital intensity | High | New express tunnels cost $5–8M; undercapitalized operators face maintenance gaps | 3–6 months operating reserves; model the full capex cycle |
| Site dependency | High | Performance is irreversibly location-specific; poor sites cannot be relocated | Require 25,000+ VPD; independent traffic audit; right-turn ingress |
| Leverage | High | Zips demonstrated that sound operating businesses fail under excess debt | Target 6–10x EBITDA maximum; debt service coverage ≥1.25x |
| Saturation | Medium | Some suburban corridors are approaching density limits | Competitive mapping within 3-mile radius before acquisition |
| Membership churn | Medium | Model at 7–8% monthly; deterioration compounds quickly | Diligence cohort retention, not just headline member count |
Section 6: Due Diligence Framework
For a buyer — and equally for a seller preparing to withstand diligence — the sector's diligence priorities are unusually specific:
Traffic and site quality. Independent vehicle-per-day audit, ingress and egress configuration, visibility, and competitive density within a three-mile radius.
Membership quality, not quantity. Cohort retention curves, monthly churn by vintage, ARPU trend, and the proportion of members acquired through discounting.
Deferred maintenance. Tunnel equipment, reclaim systems and pay stations have defined replacement cycles. Deferred capex is a direct deduction from purchase price.
Lease structure. Where sites are leased, term, escalators and assignment provisions materially affect what a buyer can pay — and in the Zips case, fixed rent obligations were the proximate cause of failure.
Water and environmental compliance. Reclaim system capability and discharge permitting vary by jurisdiction and can carry material remediation cost.
Section 7: 2026 Outlook
7.1 Positive Catalysts
- Moderating interest rates reduce financing friction for acquisition structures
- Bid-ask gaps have substantially narrowed; expectations have largely converged versus 2023
- The Zips restructuring resolved a significant sentiment overhang
- The Mister take-private removes the public market valuation drag; private benchmarks may reset higher
- Approximately $1.4 trillion of global PE dry powder seeking recession-resilient sectors
7.2 Expected Deal Characteristics
- Bolt-on and densification acquisitions by existing platforms will dominate over new platform formation
- Independent operator exits accelerate as subscription competition intensifies against unbranded sites
- Distressed and underperforming sites attract value-oriented buyers at 6–8x, or on a cost basis where earnings will not support a multiple
- The Mister take-private may ultimately produce regional divestitures, creating a super-regional opportunity
- Buyer participation breadth should increase versus the concentrated 2024 market
Neo Advisory's View
What follows is our position rather than reported fact, and we have separated it deliberately so a reader can rely on the evidence above while disagreeing with the conclusion. It draws on that evidence and on direct involvement in sell-side processes in this sector.
1. This is a better market to sell into than 2022, and that statement is not contrarian for its own sake.
In 2022, at 20x multiples, sellers competed for attention from a small number of aggressively-levered buyers who were themselves buying on assumptions that later proved wrong. Several of those buyers subsequently restructured. Closing at a headline multiple means nothing if the transaction carries financing risk, extended earn-outs, or a buyer who cannot fund.
Today's market has more buyers, across three distinct tiers, competing more selectively with better-structured capital. A well-prepared seller today faces more genuine competition for their business than a comparable seller did at the peak — at a lower multiple, but with materially higher execution certainty.
2. The scale premium is the whole game, and it is addressable.
A performing single site trades at 8–10x TTM EBITDA. A multi-site platform trades at 10–12x. That two-turn spread is not a reward for owning better car washes — the underlying assets can be identical. It is a reward for being a platform: management depth, systems that run without the principal, geographic density, and financial presentation a diligence team can rely on.
Below both sits the underperforming band at 6–8x — or a cost basis where earnings will not carry a multiple at all — and the thresholds separating it are specific: 2,000 active members, sub-6% monthly churn, above-average ARPU, 25,000+ vehicles per day. Those are operating metrics, not structural facts. A site at 8% churn and 1,400 members is not permanently a 5x asset.
Our view is that 12 to 18 months spent moving churn toward 6%, deepening membership penetration and building a second layer of management is worth more than any negotiating tactic available at the table — because it moves the business between bands rather than up within one.
3. Do not run a sale process anchored to 2021 pricing.
The widest bid-ask gaps in this sector are not caused by buyers underpaying. They are caused by sellers benchmarking to a multiple environment that existed for roughly eighteen months and is not returning. We have watched processes fail on this alone.
The 20x era was a function of zero-rate financing and land-grab competition among sponsors who have since learned what those assets actually earn. An owner whose valuation expectation was formed in 2022 should reset it before going to market, not during.
4. Sale-leaseback is the most misunderstood instrument in the sector.
Zips is the cautionary case, and the lesson is frequently misread as "avoid sale-leasebacks." That is wrong. Net-lease investors price car wash real estate at 6.0–6.5% cap rates, which is often better than the implied real estate value inside an operating multiple — the arbitrage is real and worth capturing.
The failure mode is not the instrument, it is the ratio. Sale-leaseback proceeds converted into acquisition leverage, with rent obligations underwritten against a base case rather than a downside case, is what broke Zips. Model the rent stack against a 15% revenue decline before signing anything.
5. Membership is not a marketing program. It is the asset.
At 40–75% of revenue for express operators — 80% for the best — the membership base is the business a buyer is acquiring. Yet most sellers present membership as a headline count rather than as the contracted revenue stream it actually is.
The sellers who achieve premium outcomes present cohort retention curves, churn by vintage, ARPU trend and acquisition channel mix, with the same rigor they apply to financial statements. That presentation does not merely support the valuation — it is the valuation.
Conclusion
The car wash sector has passed through a complete capital cycle and arrived somewhere more rational than where it started. Multiples stabilizing near 10x are not a sign of distress; 20x was the anomaly. Deal volume recovering from 70 transactions in 2024 to 82 in 2025, with buyer participation broadening across three tiers, describes a functioning market rather than a recovering one — even against a 2022 peak of 211 that is not returning.
For owners, the implication is specific. This is a market that pays properly for evidence and for scale, and discounts heavily for the absence of either. Performing single sites transact at 8–10x TTM EBITDA today, multi-site platforms at 10–12x, and assets that cannot evidence membership retention, throughput and traffic at 6–8x or on a cost basis.
Those two gaps are the opportunity. Both are measured in operating metrics and management structure rather than in asset quality, both are addressable within 12 to 18 months, and together they are worth more than any other lever available to an owner considering an exit.
Related Research
- 2026 Collision & Repair Sector Market Overview — our sector analysis of the adjacent collision repair market, covering consolidation, ADAS calibration economics and 2026 M&A outlook.
- Sell-Side M&A Advisory — how we run a confidential sale process for founder-led businesses.
- Frequently Asked Questions — process, timelines, valuation and fee structure for owners considering a sale.
- Industries We Serve — our sector focus across the automotive aftermarket.
- Washing Away Debt: Zips Car Wash and the Cost of Private Equity Ambition — our founder's April 2025 analysis of the Zips restructuring.
- Miracle Car Wash Advisors — specialist car wash real estate and M&A advisory.
Sources and Methodology
This report combines Neo Advisory research with Miracle, LLC Transaction Data, published market data, and company disclosures through Q1 2026. Market sizing reconciles multiple third-party research providers, whose estimates differ on scope and methodology; where we present a calibrated range, it is identified as a Neo Advisory estimate. Transaction data is drawn from publicly announced deals and company disclosures. Deal values for private transactions are generally undisclosed.
The views expressed in the Neo Advisory's View section are our own, and reflect direct involvement in sell-side processes in this sector alongside the data cited above.
- Mister Car Wash — Take-private by Leonard Green & Partners at $7.00 per share: transaction terms, enterprise value, timing.
- Zips Car Wash — Chapter 11 restructuring announcement: debt quantum, restructuring terms, emergence.
- Market sizing: Grand View Research, Mordor Intelligence, IBISWorld, Future Market Insights.
- Sector benchmarks and operating metrics: International Carwash Association, industry benchmarking data, operator disclosures.
- Transaction counts: Miracle, LLC Transaction Data.
- Platform and buyer landscape data: Neo Advisory research, publicly announced transactions, CoStar, company disclosures.
- Sector advisory context: Miracle Car Wash Advisors.
- Prior analysis of the Zips restructuring by this report's author, published April 2025: FOCUS Investment Banking.
- Charts prepared by Neo Advisory from the data cited in each figure.
Prepared by John-Michael Tamburro, Founder, Neo Advisory.
This report is prepared for informational and publication purposes only. It does not constitute investment or financial advice. All figures are estimates and subject to revision, and forward-looking projections are inherently uncertain.