Executive Summary
The U.S. collision repair industry emerged from a turbulent 2025 with a complex and evolving strategic picture. Record-high total-loss frequency, tariff-driven parts inflation, declining repairable claim volumes, and a persistent technician shortage created meaningful headwinds for operators across the size spectrum. Yet the industry also demonstrated resilience: private equity appetite remained robust, consolidation continued, and a single transformational transaction reshaped the competitive landscape.
The acquisition of Joe Hudson's Collision Centers by Boyd Group's Gerber — collapsing the legacy "Big Five" into a leaner "Big Four" — was the defining corporate event of 2025. The combined entity now operates 1,301 North American locations (Boyd Group), narrowing the gap with market leader Caliber Collision and establishing undisputed regional dominance in the Southeast. This transaction signals that large-scale combinations remain achievable even in challenging market conditions and likely catalyzes further consolidation among the remaining major players.
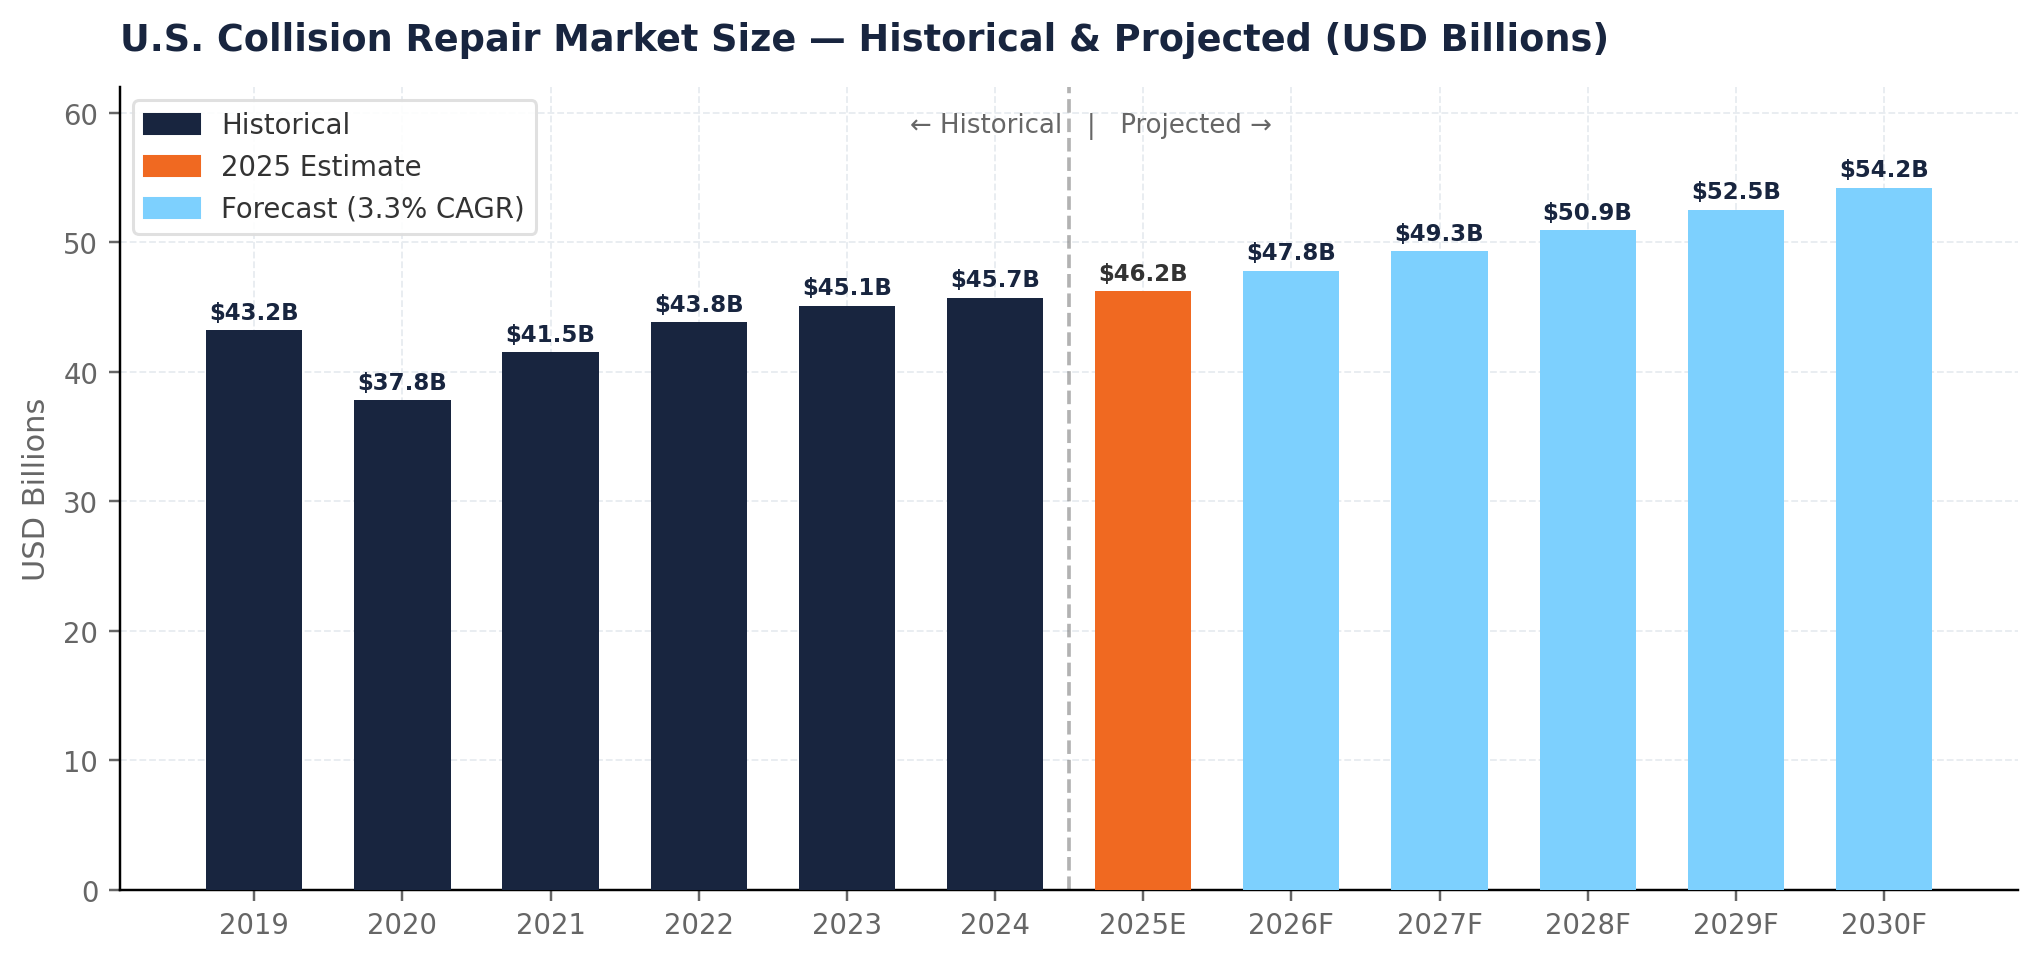
KEY INSIGHT The U.S. collision repair market reached $46.2 billion in 2025 and is projected to grow to $54.2 billion by 2030 (3.3% CAGR) (Mordor Intelligence), supported by an aging vehicle fleet, rising repair complexity, and sustained private equity interest — even as claim frequency declines and total-loss rates hit record highs.
This report synthesizes market data, transaction intelligence, and operational benchmarks to provide a comprehensive view of the industry across five core dimensions:
- Market Size & Structure: A $46.2B U.S. market with growing global significance, dominated by ~40,000 shops with significant fragmentation below the Big Four tier
- Claims & Economics: Declining repairable claim volumes, record total-loss rates, and rising per-repair severity driven by ADAS proliferation and vehicle complexity
- Competitive Dynamics: A reshuffled Big Four landscape, aggressive PE-backed mid-tier growth, and Tesla's continued vertical integration push
- Emerging Disruptions: EV repair economics, AI-powered estimating, OEM certification proliferation, and a structural workforce crisis
- 2026 Outlook: Cautious optimism on M&A recovery, persistent secular volume headwinds, and strategic imperatives for operators and investors
The fundamental investment thesis remains intact: defensive cash flows, a fragmented market ripe for consolidation, and rising revenue per repair driven by vehicle technology complexity. However, the operational environment demands greater selectivity and technical investment than at any prior point in the industry's modern consolidation era.
Section 1: Market Overview
1.1 Market Size & Growth
The North American automotive collision repair market was valued at approximately $46.2 billion in 2025 and is projected to expand to $54.2 billion by 2030, representing a compound annual growth rate (CAGR) of approximately 3.3%. The United States accounts for roughly 84% of North American revenue, underpinned by a 289-million-unit light vehicle fleet and a mature auto insurance infrastructure that channels approximately 70% of all collision claims through Direct Repair Program (DRP) networks.
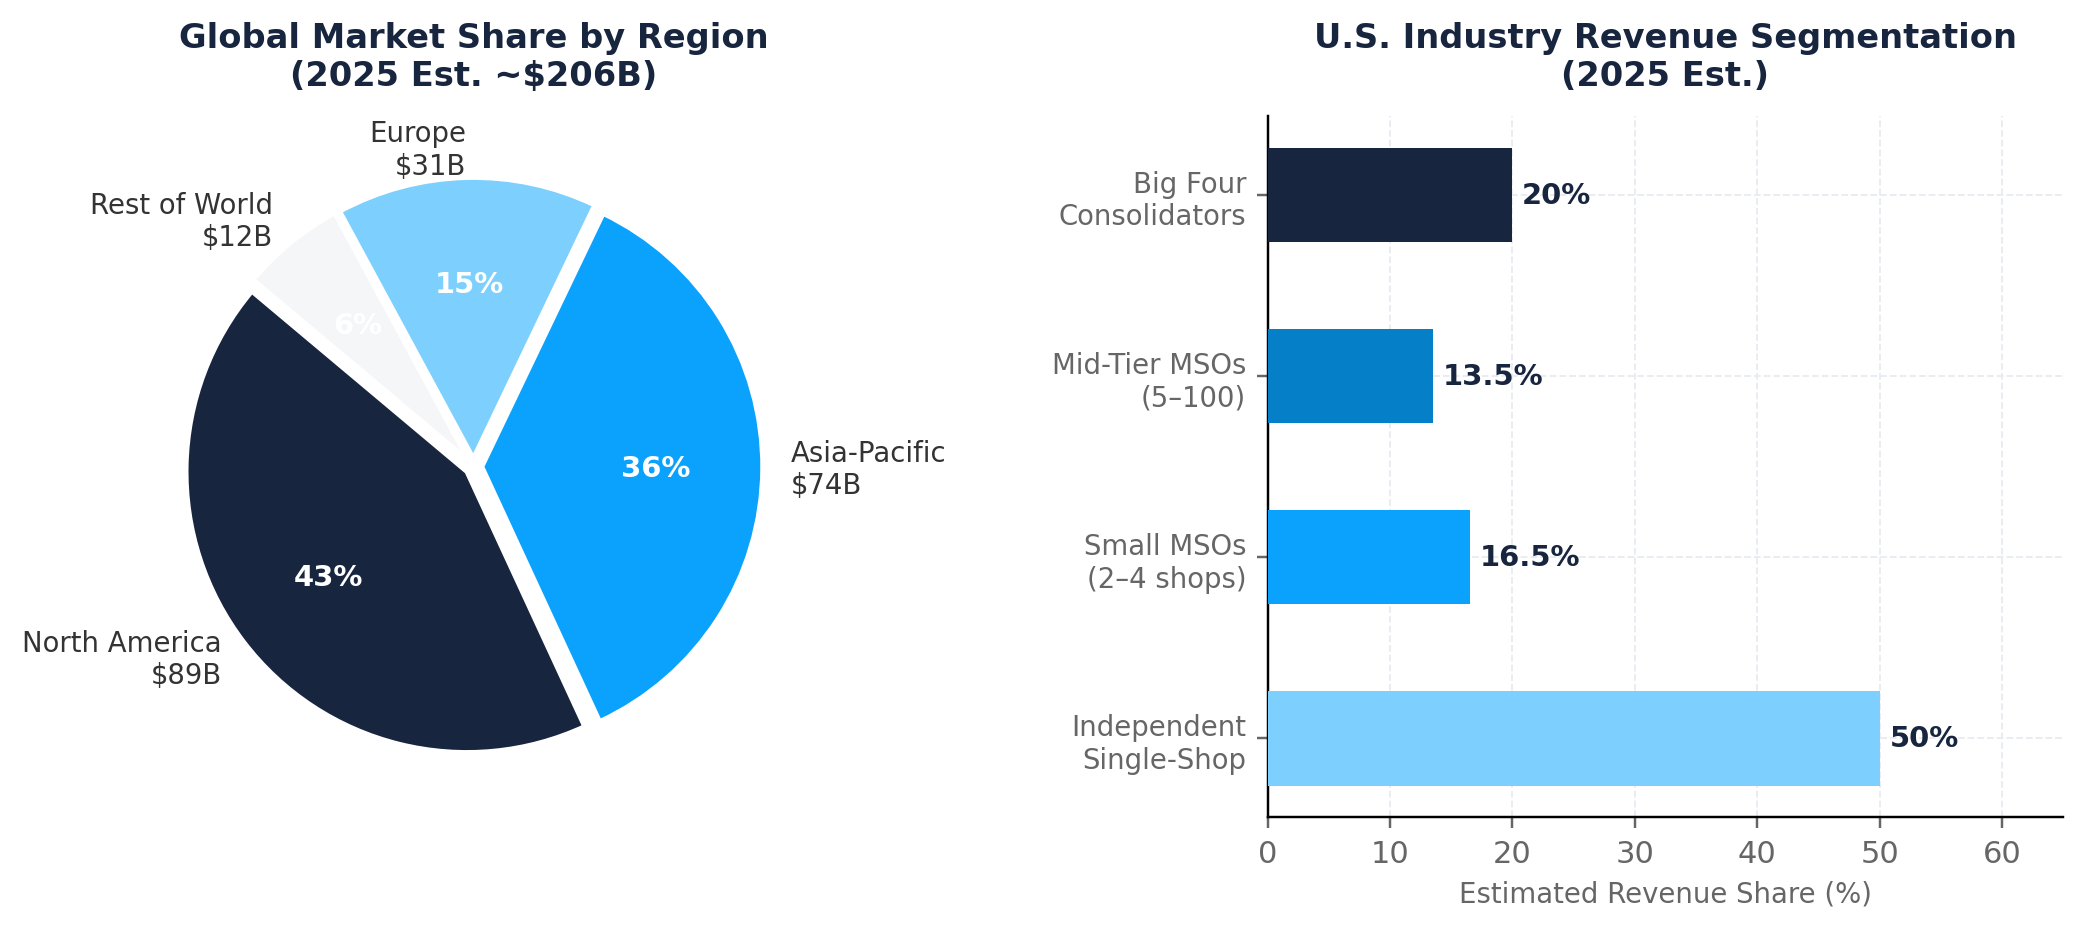
Globally, the collision repair market is estimated at approximately $206 billion in 2025, with projections suggesting growth to approximately $228–237 billion by 2032 at a modest CAGR of 1.8–2.0%. North America commands the largest single-region share at approximately 43%, while Asia-Pacific represents the fastest-growing geography, driven by rapid vehicle ownership expansion, urbanization, and improving insurance penetration across China, India, and Southeast Asia.
1.2 Industry Structure
The U.S. collision repair industry remains moderately fragmented despite a decade of accelerating consolidation. Approximately 40,000 repair shops operate nationally, ranging from independent single-location shops to multi-thousand-location consolidators. The Big Four collectively operate approximately 3,970 locations — representing less than 10% of all U.S. locations but commanding an estimated 18–22% of total revenues due to their DRP leverage, procurement scale, and operational density.
| Segment | Est. Locations | Revenue Share | Key Characteristics | M&A Role |
|---|---|---|---|---|
| Big Four Consolidators | ~3,970 | ~18–22% | Scale, DRP leverage, PE-backed or public | Primary acquirers |
| Mid-Tier MSOs (5–100 shops) | ~2,500 | ~12–15% | Regional dominance, growing PE interest | Acquirers & targets |
| Small MSOs (2–4 shops) | ~12,000 | ~15–18% | Owner-operated, prime acquisition targets | Primary targets |
| Independent Single-Location | ~22,000 | ~45–55% | Fragmented, local market dependent | Long-tail acquisition pool |
1.3 Demand Drivers
Several structural factors continue to underpin long-term demand even as near-term volume faces cyclical pressure:
- Aging Vehicle Fleet: The average U.S. passenger vehicle age rose to 12.7 years in 2024 and is projected to reach 13 years by 2026, keeping repair volumes structurally supported. Vehicles seven years or older now constitute nearly 45% of all repairable claims, up from 35% in 2019.
- ADAS Proliferation: Calibration requirements appeared on 35.6% of all DRP repair estimates in Q3 2025 — up from 26.9% in Q3 2024, a near 9-percentage-point jump in 12 months (CCC Crash Course Q3 2025; Repairer Driven News). A December 2025 Revv benchmark study found that roughly 61% of vehicles arriving for collision repair require some form of ADAS calibration.
- Rising Repair Complexity: Modern vehicles incorporating aluminum, high-strength steel, carbon fiber, and dense electronics require specialized equipment and expertise. Diagnostic scans now appear on 87.7% of all estimates (CCC Crash Course Q3 2025).
- Insurance Infrastructure: Mature DRP networks channel approximately 70–90% of all insured collision claims to preferred shops. In 2020, DRP-sourced claims accounted for approximately 90% of collision repair revenue industry-wide, with 82% of insured customers selecting a DRP shop.
- Vehicle Miles Traveled: VMT grew 0.9% year-over-year through Q3 2024, with return-to-office policies representing a potential upside driver for 2026 accident frequency.
- Uninsured/Underinsured Exposure: Auto casualty claims involving uninsured or underinsured motorists rose 11% in 2024, adding complexity and volume pressure to the claims ecosystem.
ADAS IMPACT ADAS calibrations add $250–$600 to the average repair order, and calibration requirements appeared in over one-third of all DRP estimates in 2025 — a trend accelerating as ADAS-equipped vehicles increasingly dominate the active fleet. Approximately 61% of vehicles arriving for repair require some calibration, yet nearly half of all U.S. shops miss required post-repair calibrations — creating both a liability risk and a revenue opportunity.
Section 2: Key Industry Metrics
2.1 Claim Trends & Total Loss Frequency
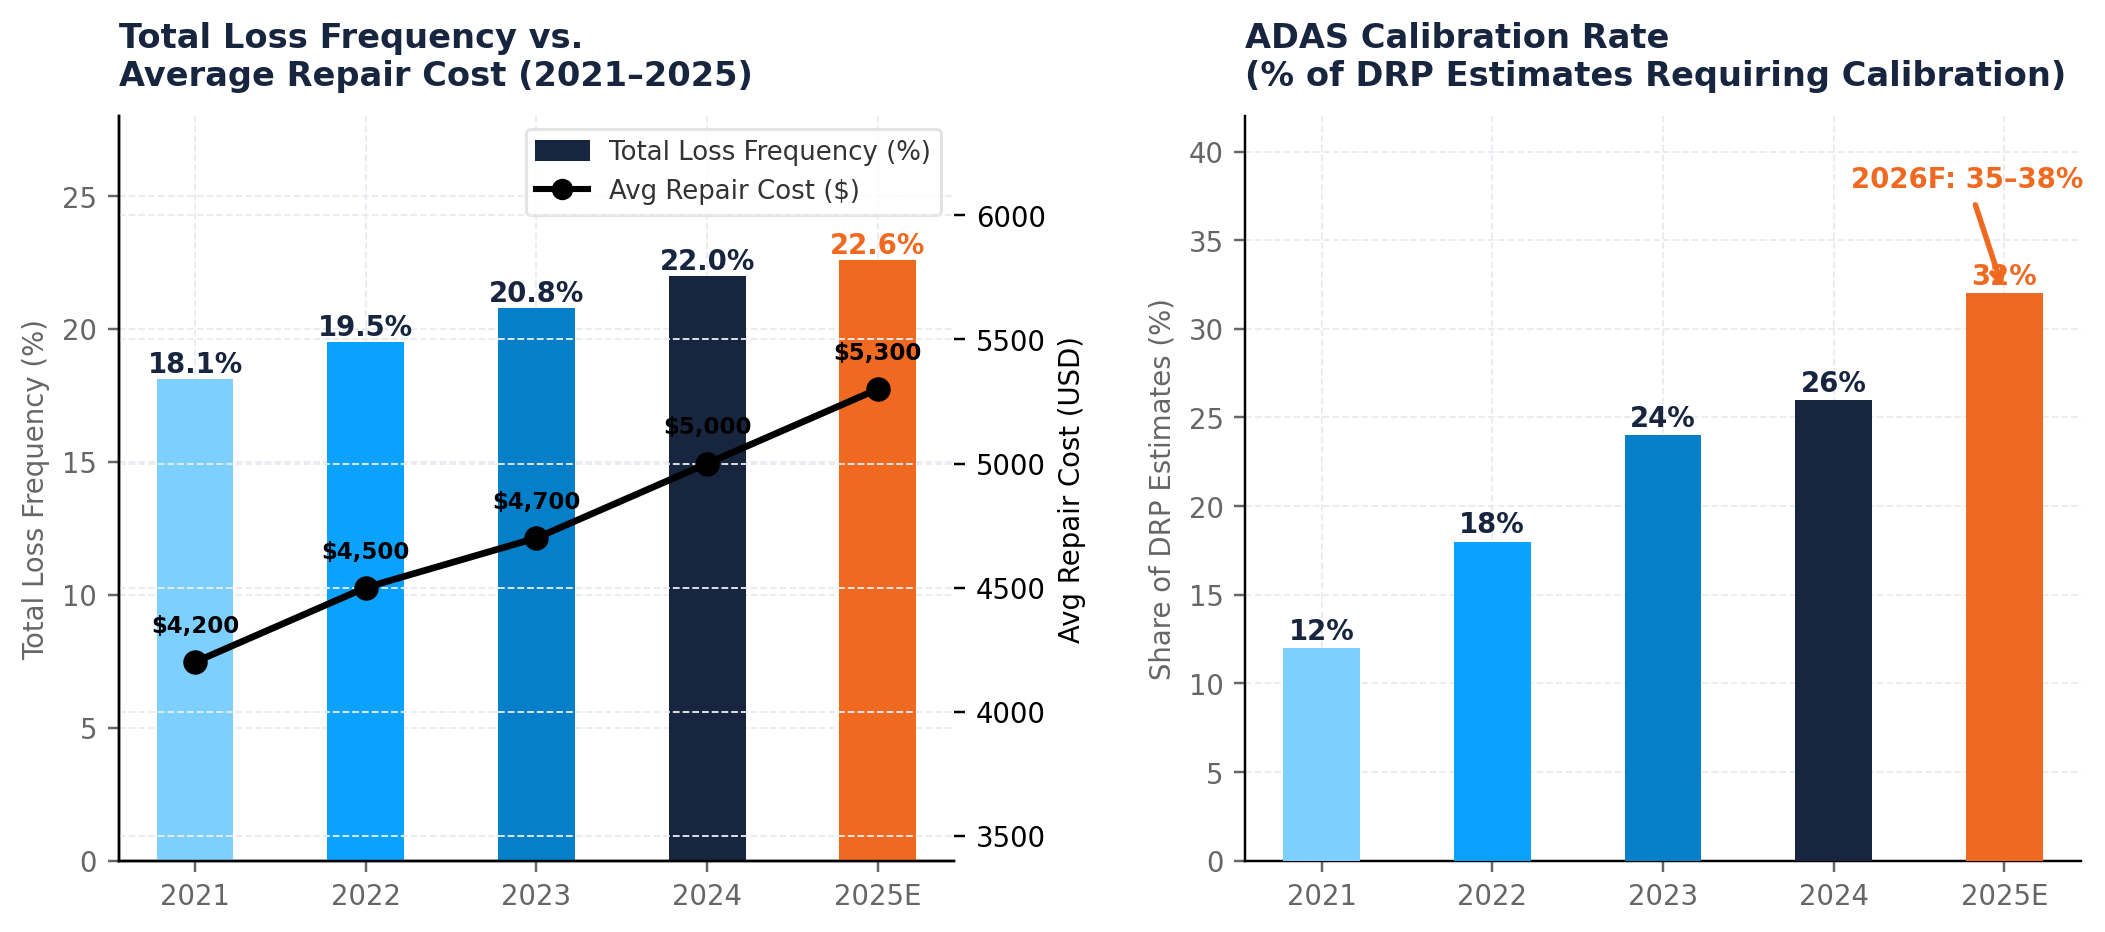
The most pressing challenge facing collision repairers in 2025 was a sustained decline in repairable claim volume. Repairable claims fell 10.4% through August 2025 compared to the same period in 2024 (CCC Crash Course), driven by a combination of cyclical factors (mild weather, fewer hail events, elevated deductibles) and secular forces (ADAS frequency reduction, total-loss substitution). Meanwhile, total-loss frequency climbed to a record 23.1% of all claims in 2025 — and 23.9% of non-comprehensive losses, both new high-water marks in CCC's data (CCC Crash Course 2026) — as rising repair costs intersected with elevated vehicle values to push an increasing share of claims into total-loss territory.
Small repairs are disappearing rapidly: jobs under $2,000 now constitute just one-quarter of all appraisals, down sharply from pre-pandemic levels. Higher deductibles are a significant driver — more than one in four drivers now carries a deductible of $1,000 or greater, suppressing insured claim filings for minor incidents and driving growth in customer-pay work. Third-party bodily injury claims, by contrast, jumped 8% in 2024, with average payouts per injured party reaching $27,373.
| Metric | 2023 | 2024 | 2025E | Trend & Driver |
|---|---|---|---|---|
| Total Loss Frequency | 20.8% | 22.0% | 23.1% | Rising — vehicle complexity & values |
| Avg Repair Cost (all claims) | $4,700 | $5,000 | $5,300+ | Rising — parts, labor, complexity |
| ADAS Calibration Rate (DRP) | 24% | 26% | 35.6% (Q3) | Rapidly rising — fleet penetration |
| Repairable Claims YoY Change | +3.2% | -4.1% | -10.4% (YTD) | Declining — structural + cyclical |
| Diagnostic Scan Rate | ~80% | 86.9% | 87.7% | Rising — near-universal on DRP |
| 3rd Party BI Avg Payout/Injured | ~$24K | $27,373 | Est. $28K+ | Rising — medical cost inflation |
| Avg Labor Hours per Claim | 27.4 | 27.6 | ~26.7 | Declining — fewer heavy hits |
2.2 Parts Costs, Tariffs & Supply Chain
Parts costs experienced meaningful inflation in 2025. Year-over-year OEM part price increases exceeded 4% in Q1 and rose 2.1% quarter-over-quarter from Q1 to Q2 2025 — double the rate of the prior year — with cumulative mid-year increases surpassing 6%. The primary driver was U.S. trade policy. Starting April 3, 2025, the administration imposed a 25% tariff on imported automobiles under Section 232 of the Trade Expansion Act of 1962, followed by a 25% tariff on automotive parts and components effective May 3, 2025.
Approximately 44% of OEM collision parts sold in the U.S. are manufactured overseas, according to PartsTrader. Existing tariffs are estimated to add roughly $100 to the parts line of an average repair order. Aftermarket parts initially showed inflation resistance — holding at under 1% increase — but this buffer has narrowed as pre-tariff inventory has been depleted. The American Property Casualty Insurance Association estimates that a 25% tariff on imported repair parts, all else equal, could raise the cost of a typical auto insurance claim by approximately 3%.
TARIFF IMPACT Detroit's Big Three collectively absorbed over $3.6 billion in tariff charges in 2025: GM booked a $1.1B hit in Q2, Ford absorbed $800M, and Stellantis flagged $1.7B in tariff costs — with warnings of higher downstream costs flowing through the repair ecosystem. Sheet metal components (hoods, fenders, bumpers) are largely exempt from the 25% duty under current Section 232 rules, but a January 2026 petition window could expand coverage to these high-volume collision parts.
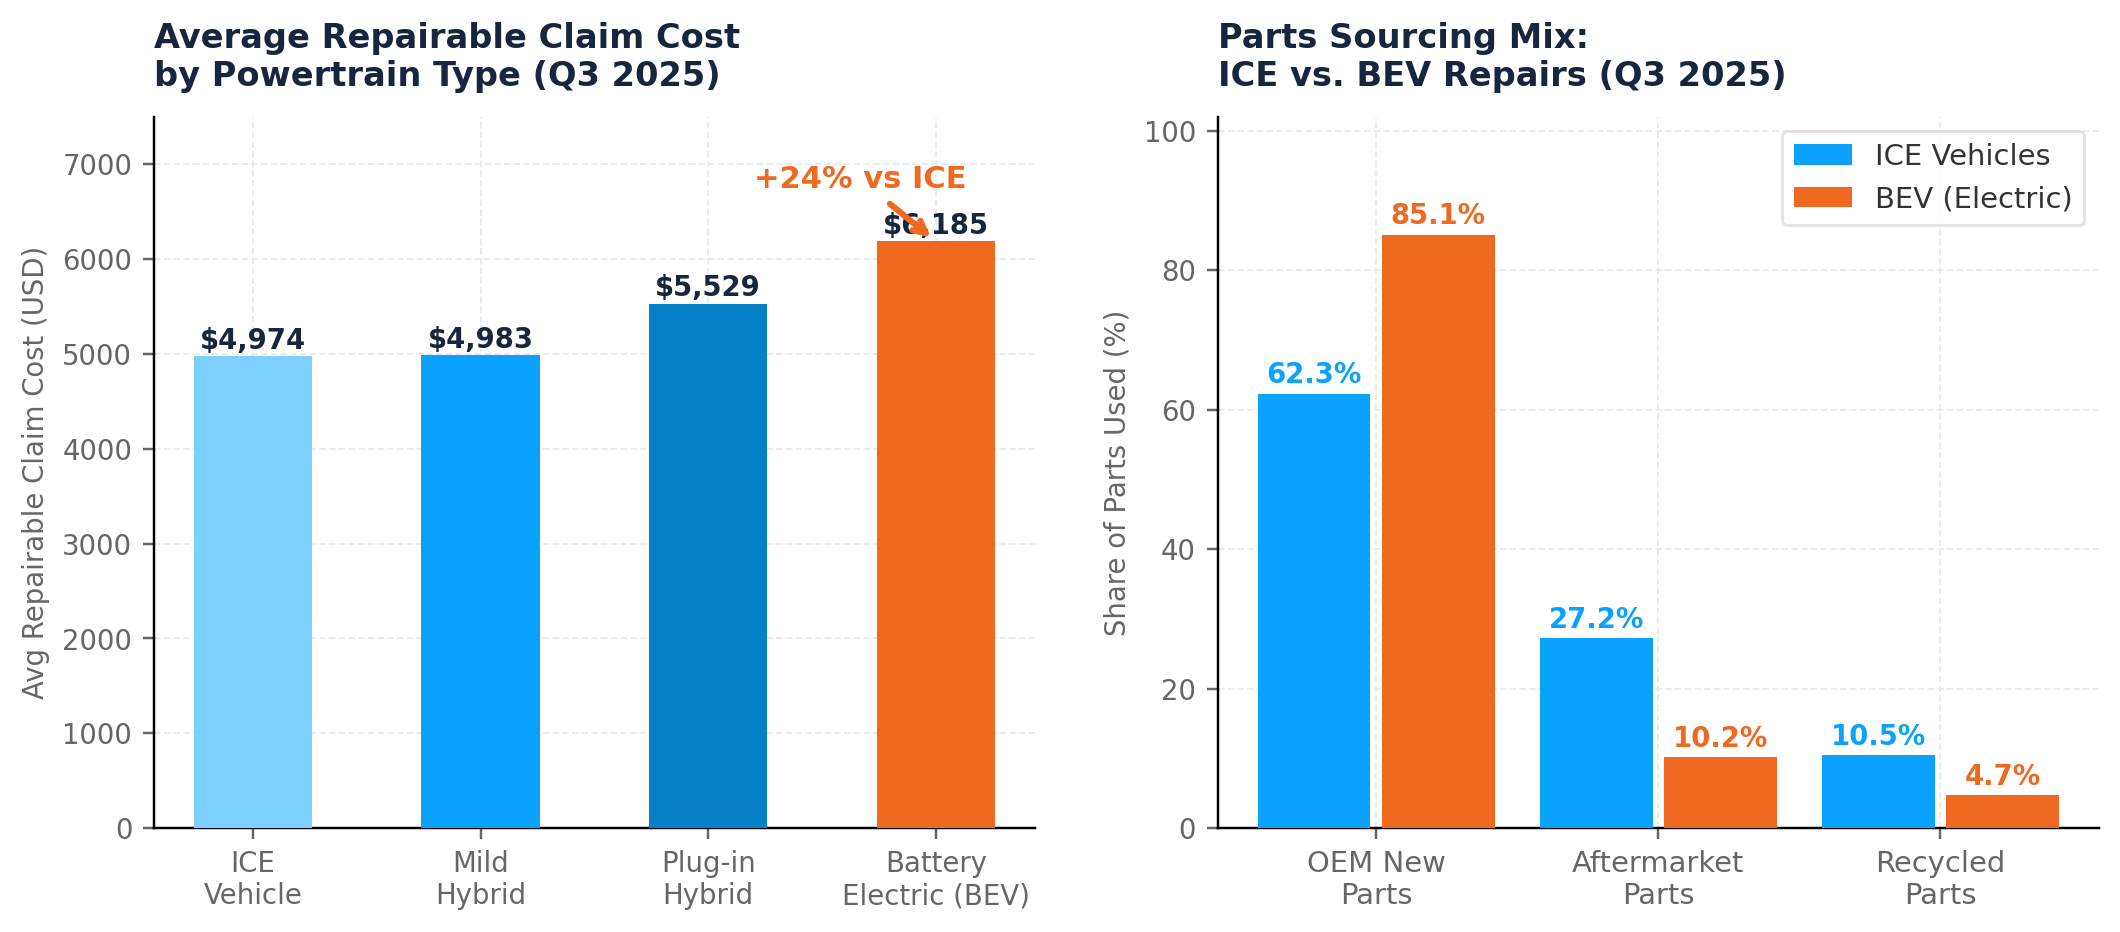
| Parts Category | % ICE Repair | % BEV Repair | Tariff Exposure | 2025 Price Trend |
|---|---|---|---|---|
| New OEM Parts | 62.3% | 85.1% | High (44% imported) | +4.3% (Q2 vs Q1 2025) |
| Aftermarket Parts | 27.2% | 10.2% | Medium | Flat early; rising later |
| Recycled / Salvage | 10.5% | 4.7% | Low (domestic) | Modestly rising |
| Remanufactured | Small | Nascent | Low-Medium | Growing segment |
Section 3: The Insurance Ecosystem
3.1 DRP Dynamics & Insurer Leverage
The relationship between insurers and collision repairers sits at the core of the industry's economics. Direct Repair Programs (DRPs) — first pioneered by Allstate in the 1970s — have evolved into complex, KPI-governed partnerships that simultaneously provide shops with reliable volume and subject them to margin pressure, pricing controls, and parts-type mandates. In 2020, DRP claims accounted for approximately 90% of collision repair revenue, and 82% of insured customers directed their claims to a DRP shop.
DRP agreements typically govern labor rate ceilings, approved parts sourcing protocols, cycle time requirements, customer satisfaction scoring, supplement approval workflows, and technology platform requirements. State Farm's "Select Service" program and Allstate's "PRO" program are two of the most prominent examples, each with distinct KPI structures and performance benchmarks that shops must maintain to retain placement. The competitive environment is bifurcating — large, well-capitalized MSOs can negotiate program terms, while smaller operators must accept standard conditions or risk removal.
DRP CONCENTRATION RISK A single insurer DRP relationship can represent 30–50% of total shop revenue for highly DRP-dependent operators. PE underwriters treat this as a concentration risk and typically require a diversified DRP portfolio across at least 3–5 carriers before underwriting a platform-tier acquisition. DRP removal — triggered by KPI underperformance — can reduce a shop's enterprise value by 20–40%.
3.2 Insurance Industry Financial Dynamics
The financial health of the auto insurance industry directly shapes the volume, pricing, and authorization behavior of the collision repair ecosystem. The P&C industry's net combined operating ratio (NCOR) stood at approximately 99.4% in late 2024 — still strained — reflecting the pressure of rising claims costs, catastrophic weather events, and persistent medical inflation on liability lines.
Auto insurance premiums have increased substantially over 2022–2025, creating a secondary consumer behavior effect: as premiums rise, more drivers are increasing deductibles, suppressing minor claim filings and shifting volume to customer-pay channels. The share of drivers carrying $1,000+ deductibles has grown significantly, directly reducing the addressable claim pool for shops while simultaneously increasing the revenue per claim they do receive.
In a notable development, State Farm announced a record $5 billion auto insurance dividend payout in early 2026 as underwriting results rebounded — signaling improved insurer profitability that may moderate the cycle-time and parts-authorization pressure that shops experienced during the hardening market of 2022–2025.
3.3 Consumer Behavior Shifts
Three consumer behavior trends are reshaping the claims ecosystem in ways that affect shop volume and mix:
- Deductible Escalation: More than one in four U.S. drivers now carries a deductible of $1,000 or greater. This suppresses claim filings for minor damage — particularly sub-$2,000 repairs — but filters the claim pool toward more complex, higher-severity work.
- Telematics & Usage-Based Insurance: Insurers are expanding telematics programs that monitor driving behavior, rewarding safe drivers with premium reductions. Long-term, widespread telematics adoption could compress accident frequency among the safest-driving demographic.
- Policy Shopping: Customer experience and retention have become critical for auto insurers as consumers demonstrate higher willingness to switch carriers following rate increases. This creates incentive for insurers to maintain quality DRP networks as competitive tools.
Section 4: Competitive Landscape
4.1 The Big Four Consolidators
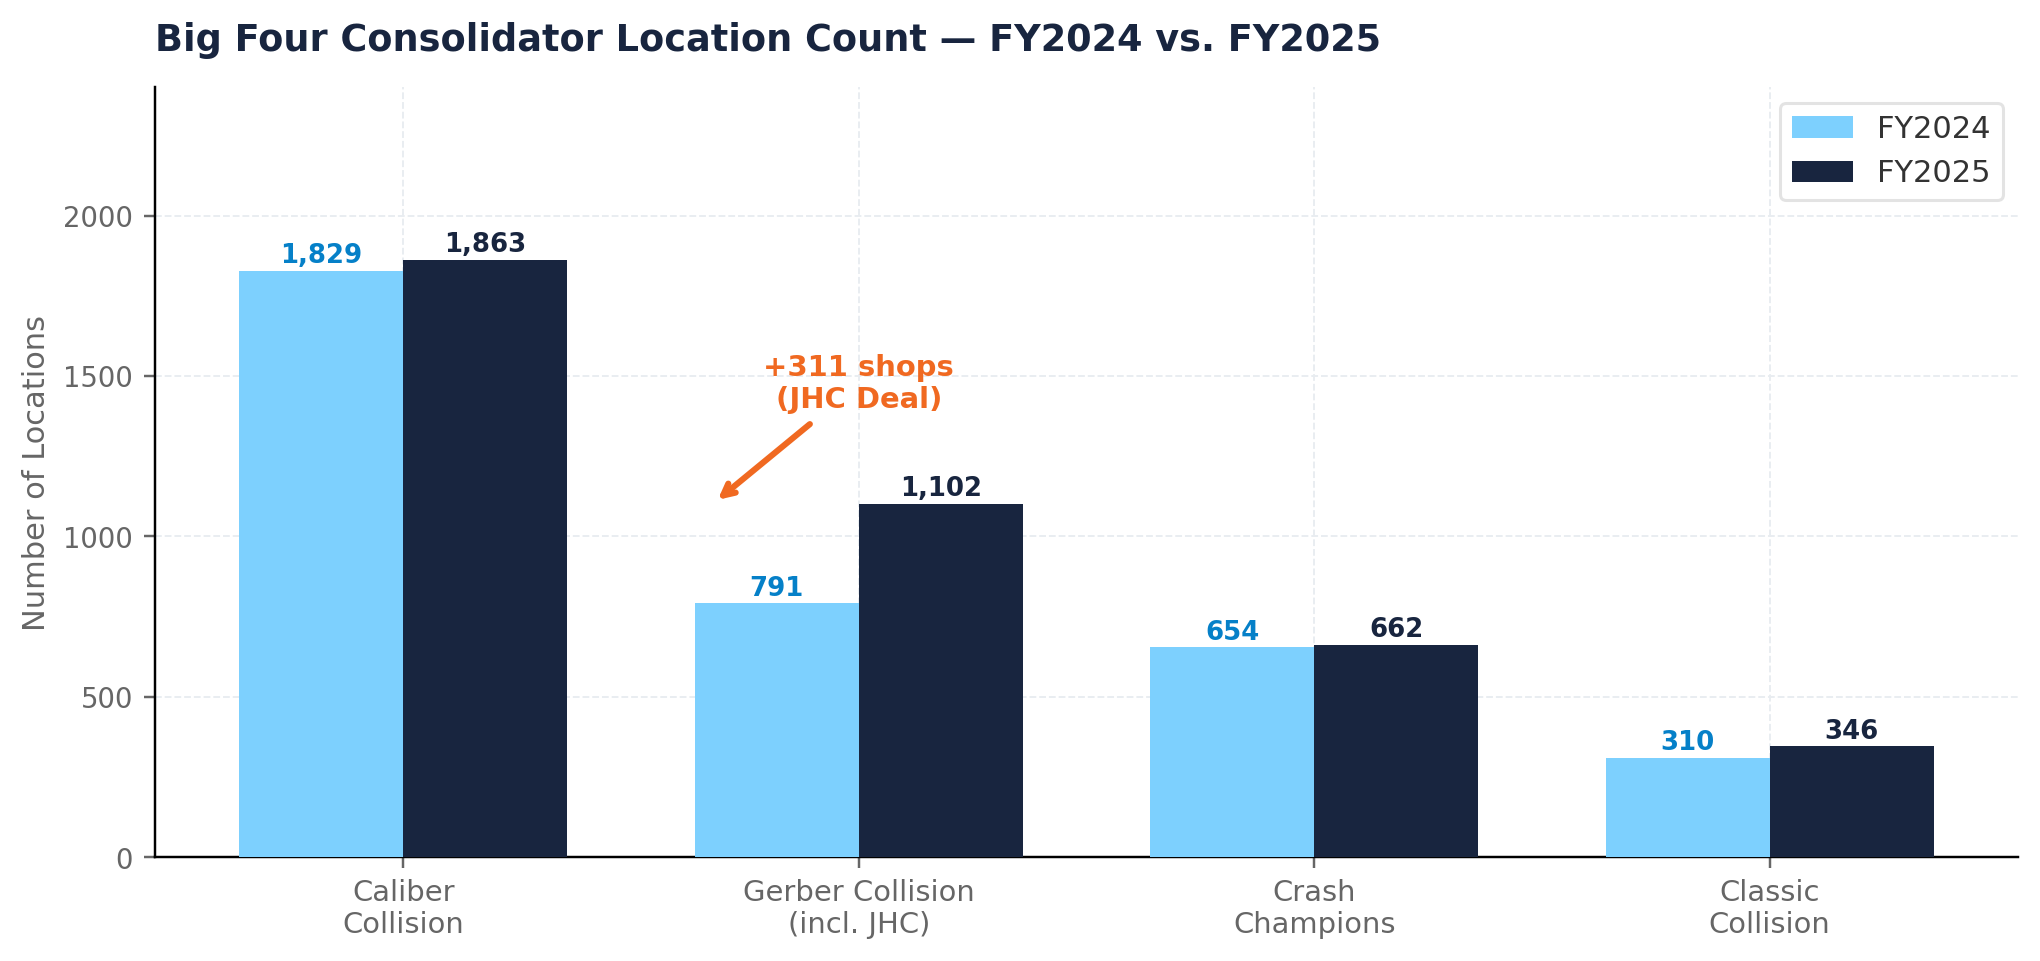
The collision repair landscape was fundamentally reshaped in late 2025 when the longstanding "Big Five" became the "Big Four" — following the transformational acquisition of Joe Hudson's Collision Centers by Boyd Group's Gerber. The combined Gerber entity now operates 1,301 North American locations, establishing regional dominance in the Southeast and significantly narrowing the gap with market leader Caliber Collision.
| Consolidator | FY2024 Locs | FY2025 Locs | Net New | Growth | Key 2025 Development |
|---|---|---|---|---|---|
| Caliber Collision | 1,829 | 1,863 | +34 | +1.9% | 1,000+ apprenticeship grads; CFO transition in Q1 2026 |
| Gerber Collision (Boyd Group) | 791 | 1,301 | +510 | +64.5% | NYSE listing; JHC acquisition (258 SE shops, ~US$1.3B, closed 9 Jan 2026) |
| Crash Champions | 654 | 662 | +8 | +1.2% | AI estimating investment; ADAS calibration build-out |
| Classic Collision | 310 | 346 | +36 | +11.6% | 5 MSO acquisitions across 6 states; urban clustering |
Caliber Collision remains the industry's largest operator with 1,863 locations, though its 2025 expansion pace slowed considerably — adding just 34 net new locations. The company continues to invest in workforce development, with its apprenticeship program having graduated more than 1,000 technicians in 2024. Caliber's scale provides significant DRP leverage and procurement advantages that independent operators cannot replicate. The resignation of its CFO in February 2026 introduces modest leadership uncertainty heading into the consolidation cycle.
Gerber's acquisition of Joe Hudson's 258 Southeast locations was the defining transaction of 2025. The deal created a 1,301-shop North American enterprise and coincided with Boyd Group's listing on the New York Stock Exchange — improving access to capital, liquidity, and acquisition currency. By absorbing Joe Hudson's dense Southeast footprint, Gerber became the clear regional leader across Alabama, Georgia, Florida, Tennessee, and the Carolinas, materially altering market concentration dynamics.
Crash Champions added just 8 net new shops in 2025, a significant deceleration from prior growth rates. The company — formed through the Service King acquisition — continues to invest in technology including AI-based estimating and ADAS calibration infrastructure. Its 662-location footprint provides meaningful regional density in key markets, positioning it as a potential acquirer of Southeast gaps left exposed by the Gerber/JHC combination.
Classic Collision demonstrated the most consistent organic consolidation activity among the Big Four in 2025, completing five MSO acquisitions totaling 28 shops across Georgia, Tennessee, Kentucky, Louisiana, Mississippi, and Virginia. Its geographic clustering strategy — focusing on dense urban markets to optimize parts delivery and labor utilization — continues to differentiate its operational model from the broader build-out strategies of Caliber and Gerber.
4.2 Mid-Tier & PE-Backed Platform Growth
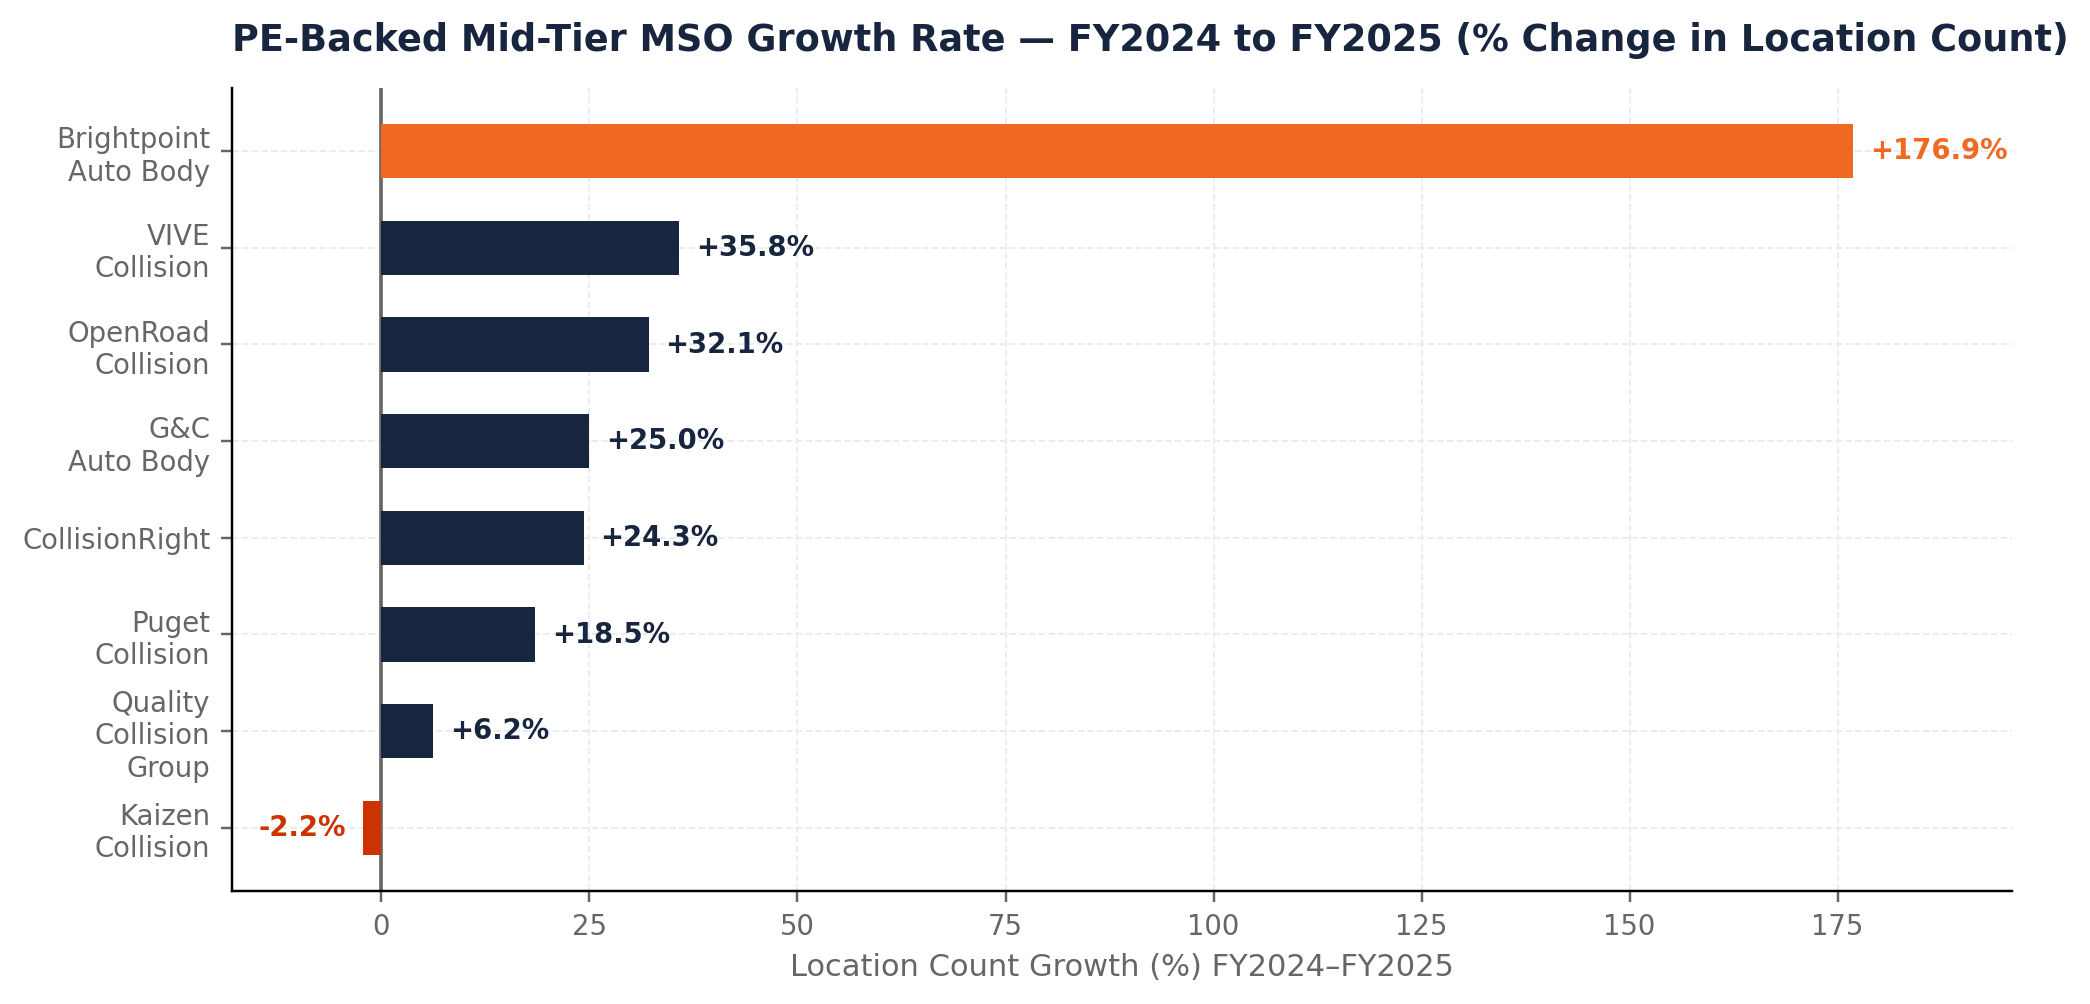
Several PE-backed mid-tier platforms demonstrated aggressive expansion in 2025, even as the Big Four moderated. Brightpoint Auto Body emerged as the most active mid-tier acquirer, growing from 13 to 36 locations (+177%) anchored by its 16-shop Stonewall acquisition across Maryland, Pennsylvania, Ohio, and Michigan. VIVE Collision and OpenRoad Collision also posted strong expansion figures, while Kaizen Collision navigated a management reset following its Kinderhook Industries acquisition.
| Platform | FY2024 | FY2025 | Net New | Growth % | PE Backer / Notes |
|---|---|---|---|---|---|
| Brightpoint Auto Body | 13 | 36 | +23 | +176.9% | Stonewall acquisition (16 shops) |
| VIVE Collision | 53 | 72 | +19 | +35.8% | Organic + bolt-on strategy |
| OpenRoad Collision | 28 | 37 | +9 | +32.1% | Texas focus; Frank's acquisition |
| G&C Auto Body | 44 | 55 | +11 | +25.0% | California MSO density build |
| CollisionRight | 103 | 128 | +25 | +24.3% | Midwest specialist; Mander's acq. |
| Puget Collision | 54 | 64 | +10 | +18.5% | Pacific Northwest regional leader |
| Quality Collision Group | 81 | 86 | +5 | +6.2% | Selective add-on discipline |
| Kaizen Collision Center | 46 | 45 | -1 | -2.2% | Kinderhook acq.; mgmt. reset |
Section 5: M&A Activity & Deal Flow
5.1 2025 Transaction Overview
M&A activity experienced a bifurcated year in 2025. Overall transaction volume declined relative to 2023 and 2024 peaks, as seller expectations remained elevated while buyer scrutiny intensified amid declining EBITDA. Many prospective sellers chose to remain on the sidelines, anticipating a revenue recovery that largely did not materialize. Despite this, the year concluded with the most consequential transaction in industry history.
The key dynamic of 2025 was the compression between steady multiples and lower absolute valuations. Market multiples remained relatively stable at approximately 7x EBITDA throughout the year — meaning buyers did not change their valuation framework. However, because shop earnings declined due to lower claim volumes and tariff-driven costs, the same multiple applied to lower earnings produced lower purchase prices. A 10% revenue decline at a $30 million MSO operating at roughly 15% EBITDA could reduce enterprise value by nearly 20%.
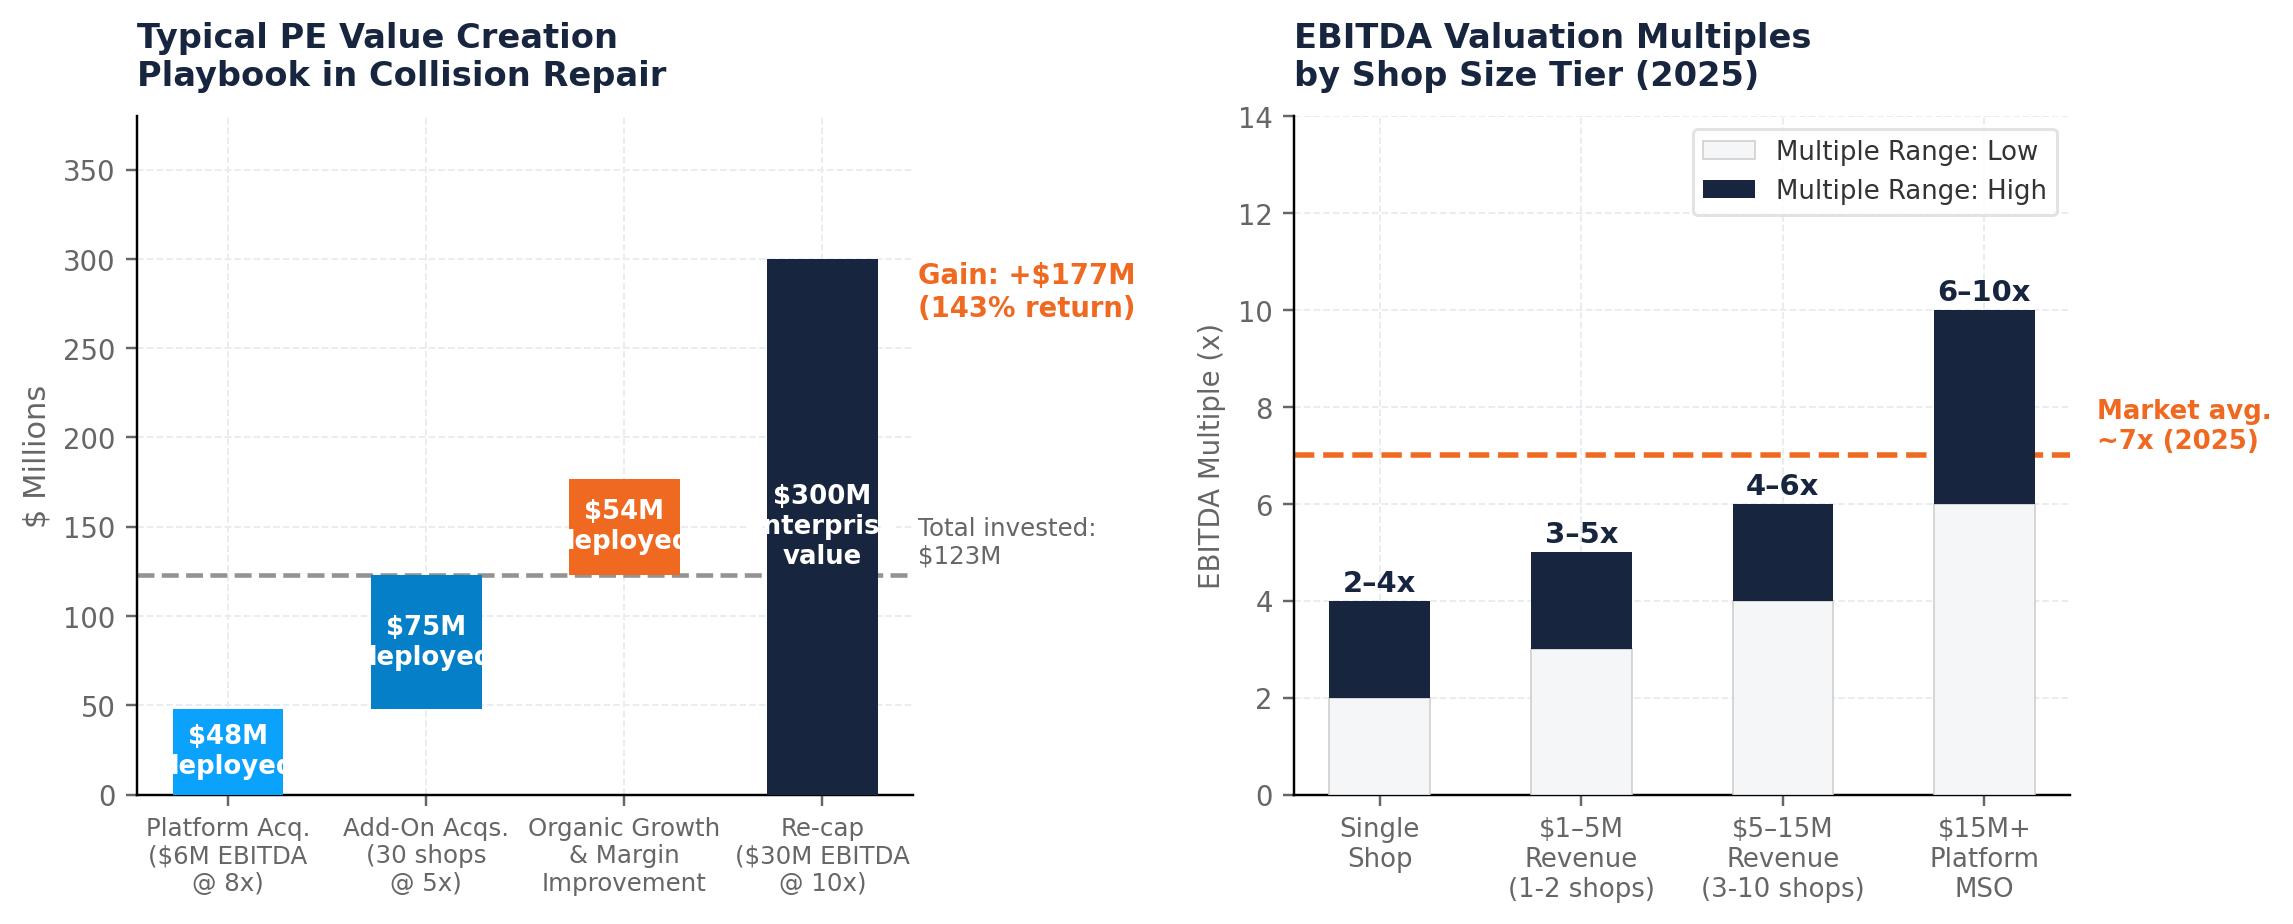
VALUATION INSIGHT Collision repair EBITDA multiples in 2025 ranged from approximately 3–5x for single shops and small MSOs ($1–5M revenue) to 6–10x for platform-level operations ($15M+ revenue). The industry average of ~7x reflects the defensive cash flow characteristics, consolidation potential, and DRP leverage that institutional buyers continue to value. PE firms typically acquire platforms at 8x and add-ons at 5x, targeting recapitalization at 10x+ upon reaching $25–30M+ EBITDA.
5.2 Notable 2025 MSO Transactions
| Acquired MSO | Acquirer | Shops | Geography | Month | Significance |
|---|---|---|---|---|---|
| Joe Hudson's Collision Centers | Gerber (Boyd Group) | 258 | Southeast U.S. | October | Industry-defining |
| CARSTAR Chilton | Trive Capital | 19 | California | February | PE-to-PE transition |
| Stonewall Collision | Brightpoint Auto Body | 16 | MD, PA, OH, MI | November | Mid-tier anchor |
| Kendrick Auto Body | Classic Collision | 9 | Georgia | December | SE density |
| Frank's Collision Repair | OpenRoad Collision | 9 | Texas | November | TX scale-up |
| Advanced Collision | Classic Collision | 8 | GA, TN | September | Urban cluster |
| L&M Auto Body | Gerber Collision | 8 | Virginia | August | Mid-Atlantic entry |
| Mander's Collision & Glass | CollisionRight | 7 | Wisconsin | January | Midwest density |
| Glaser's Collision Centers | Classic Collision | 5 | Kentucky | March | SE cluster build |
| Fradella's Collision Center | Classic Collision | 3 | Louisiana | May | Gulf Coast entry |
5.3 Private Equity Dynamics & Investment Thesis
Private equity interest in collision repair remained robust in 2025 despite broader market uncertainty — a testament to the sector's defensive cash flow characteristics. Three new PE firms entered the sector during the year, joining 14 existing investors. The "PE playbook" in collision repair is well-established and continues to drive institutional conviction:
- Platform Acquisition: PE firms typically acquire an anchor platform at 8x EBITDA (~$48M on a $6M EBITDA business)
- Add-On Acquisitions: 25–35 smaller shops are acquired at 5x EBITDA (~$75M total), creating immediate multiple arbitrage
- Operational Value Creation: 20% revenue growth and ~2% margin improvement over a 5-year hold generates $30M+ EBITDA
- Exit via Recapitalization: The expanded platform targets a 10x+ EBITDA re-rating upon sale, targeting returns of 130–150%+ on invested equity
- Leverage Amplification: Typical leverage ratios of 3:1 significantly amplify equity returns, making even modest EBITDA growth highly accretive to IRR
A meaningful shift occurred in 2025 in target profile: PE acquirers increasingly targeted smaller MSOs in the $10–25M revenue range (1–3 locations), reflecting scarcity of larger platforms and recognition that strong operators can build scale from a smaller base with comparable growth potential at better entry valuations.
PE ACTIVITY With 17 active PE-backed collision repair platforms and at least 3 additional entrants expected in 2026, buyer competition for quality assets remains intense — supporting strong valuations for well-positioned MSOs even in a more challenging operating environment.
Section 6: Emerging Trends & Disruptions
6.1 ADAS & the Calibration Imperative
Advanced Driver-Assistance Systems represent the most significant structural shift in collision repair economics. With ADAS-equipped vehicles projected to reach 50% of the active fleet by 2030, the industry faces a fundamental paradox: accident frequency is declining, yet repair severity and complexity are surging. In Q3 2025, 35.6% of all DRP appraisals included at least one calibration — up from 26.9% in Q3 2024, a near 9-percentage-point increase in 12 months. A parallel Revv benchmark study found that 61% of vehicles arriving for repair require some form of ADAS calibration, yet nearly half of all U.S. shops miss required post-repair calibrations.
The liability exposure from missed calibrations is substantial. Joel Adcock of Revv warned during an ASA webinar that an average lawsuit or settlement involving a missed calibration can cost $200,000 to $1 million or more. Calibrations add $250–$600 to each repair order and extend cycle times, creating revenue opportunity and liability risk simultaneously. New legislation introduced in late 2025 may eventually bring standardized calibration requirements, raising compliance stakes further.
6.2 Electric Vehicle Collision Repair Economics
Growing EV adoption is introducing a complex mix of new repair challenges and economics. Repairable EV claims accounted for 3.21% of all U.S. collision claims in Q3 2025, with claims frequency for BEVs rising 4.2% year-over-year as more Americans rushed to purchase EVs before the $7,500 federal tax credit expired on September 30, 2025. BEV sales jumped 36% year-over-year in Q3.
The economics of EV repair diverge significantly from ICE vehicles in several key dimensions:
- Repair Cost Premium: The average repairable BEV claim in Q3 2025 was $6,185, compared to $4,974 for ICE vehicles — a 24% premium. This gap has narrowed from prior years as repair knowledge and tooling improve.
- Parts Sourcing: OEM parts accounted for 85.1% of parts costs in EV repairs versus 62.3% for ICE vehicles, reflecting the near-absence of an aftermarket alternative parts ecosystem for EVs. This amplifies OEM pricing power and tariff exposure.
- Total Loss Dynamics: EV total-loss rates (7.35%) are approximately equivalent to comparable ICE vehicles (7.47%), dispelling the misconception that EVs are totaled more frequently. However, battery compromise — even from non-visible collision damage — can trigger totaling of an otherwise repairable vehicle.
- Insurance Premium Impact: EVs already cost 49% more to insure than comparable gas-powered vehicles, creating affordability headwinds that may moderate EV adoption and the corresponding repair volume growth.
- Hybrid Surge: While BEV growth faces policy headwinds post-tax-credit expiration, mild hybrid claims rose 21% year-over-year in Q2 2025. Hybrids are increasingly the fleet segment to watch for repair volume.
6.3 Artificial Intelligence & Digital Estimating
AI-powered damage assessment tools accelerated adoption throughout 2025 and into early 2026. Digital estimating platforms, photo-based AI appraisal tools, and automated supplement management are reducing cycle times and administrative burdens while creating new competitive dynamics between tech-equipped MSOs and traditional operators.
Key developments in 2025–2026 include: Parts Trader's December 2025 launch of "Orderly" — an AI-powered end-to-end parts procurement platform; CCC Intelligent Solutions' launch of Pay Workflow in June 2025 to modernize shop payment operations; and the broad expansion of photo-based estimating programs by major insurers including Progressive. These technology layers are simultaneously improving efficiency for sophisticated operators and widening the competitive gap with less tech-enabled shops.
6.4 OEM Certification Networks
Automakers are increasingly formalizing certified repair networks to ensure compliance with ADAS calibration requirements and structural repair standards. OEM-certified repair networks are projected to grow at a 3.64% CAGR through 2030. For shops, OEM certifications provide DRP access, premium pricing justification, and competitive differentiation — while creating meaningful cost and training barriers for non-certified competitors.
In January 2026, OEM-certified networks expanded partnerships with body shops to ensure ADAS compliance at scale. Tesla's proprietary approach — growing its own repair network to 60 U.S. locations in 2025, up from 49 — is the most extreme example of OEM vertical integration, signaling the long-term challenge that OEM-controlled ecosystems pose to independent and MSO shop volumes.
6.5 Workforce Crisis & Training Response
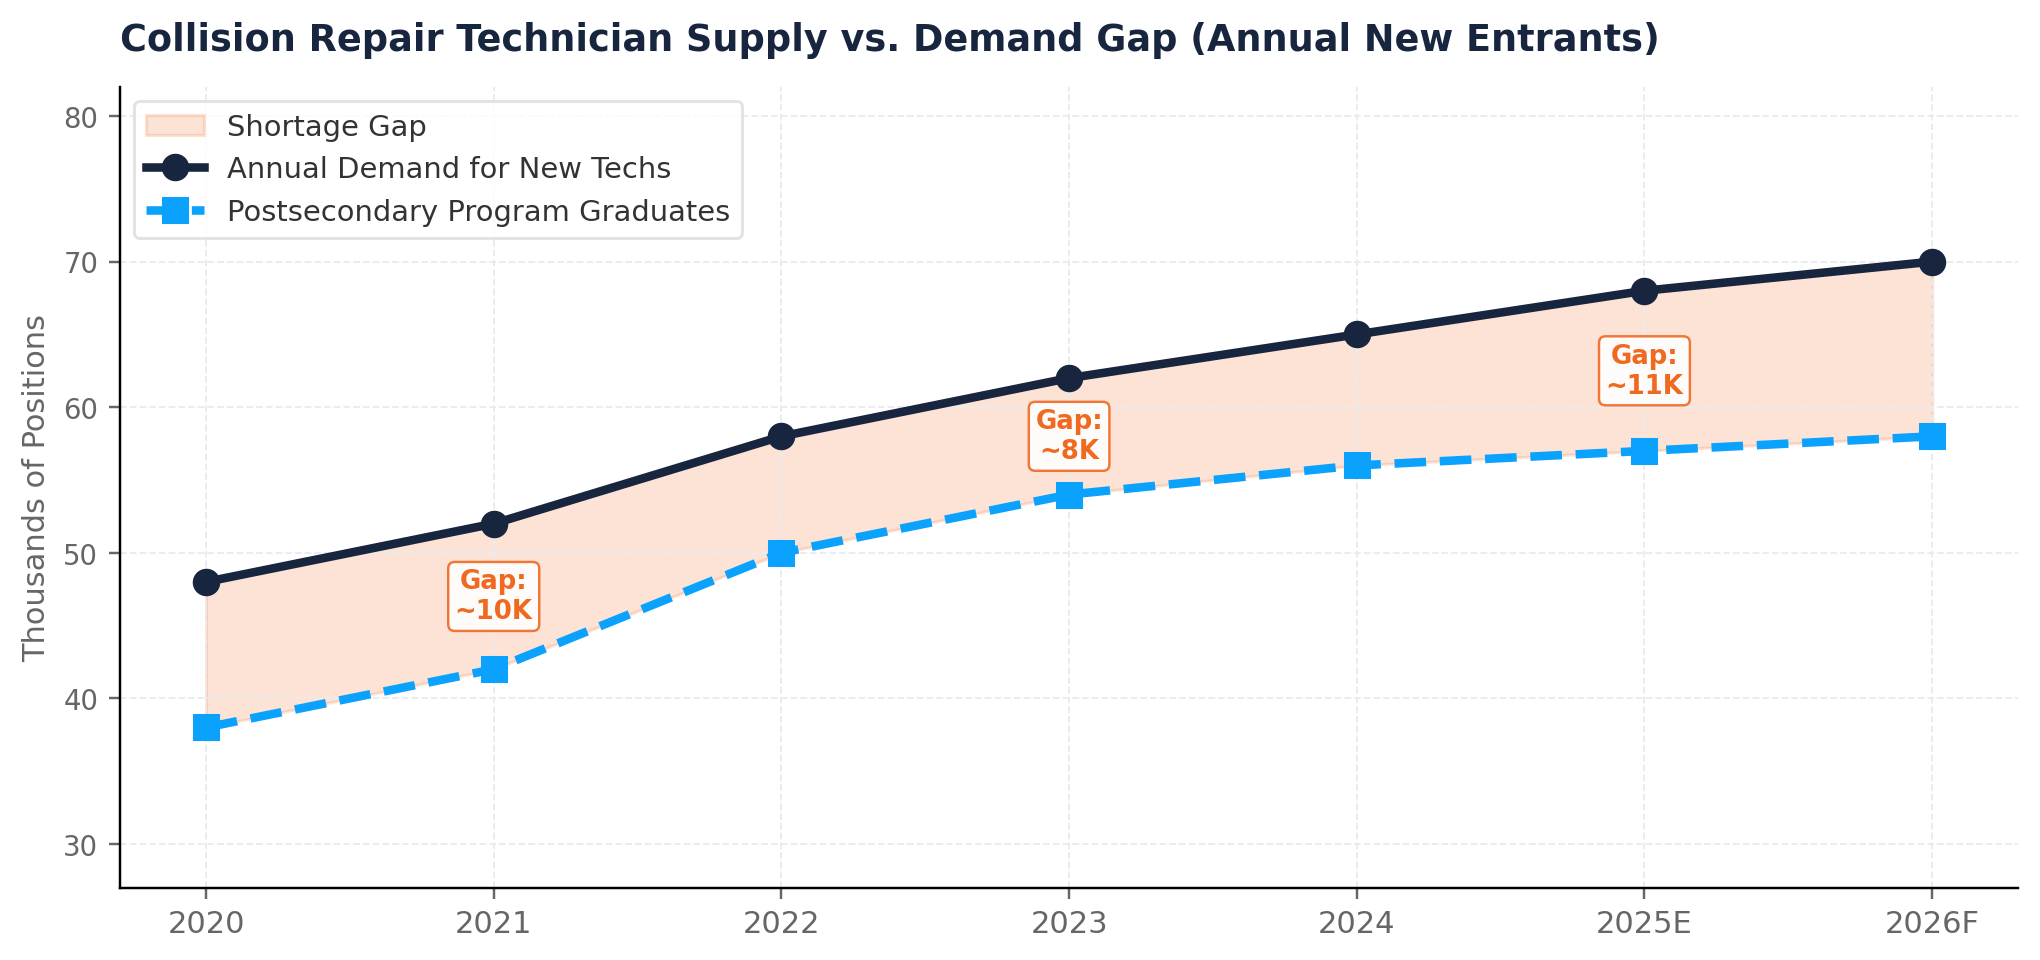
The collision repair industry faces a projected shortage of approximately 110,000 collision repair technicians over the 2023–2027 period, according to TechForce Foundation. The collision repair segment has the most severe ratio challenge in the transportation technician space — approximately 6.7 job openings exist for every program graduate. In the diesel, automotive, and collision sectors combined, replacement needs outpace workforce growth at a rate of more than 4-to-1.
The structural drivers are well-understood but difficult to resolve quickly: an aging incumbent workforce (average technician age: 40 years), a historical underinvestment in vocational education, and the stigma around trade careers among younger generations. The BLS forecasts a shortage of approximately 68,000 auto technicians every year for the next 10 years. A qualified auto technician with several years of experience can earn $80,000 per year, and ASE-certified technicians earn approximately 20% more than uncertified peers.
Positive developments include a second consecutive year of increased postsecondary completions in 2024 (per TechForce), the expansion of Caliber's apprenticeship program to 1,000+ graduates, and the TechForce-SkillsUSA collaboration targeting 5,000+ schools and 21,000 classrooms. The One Big Beautiful Bill in 2025 expanded 529 savings plan eligibility to include qualified technical training, potentially reducing the financial barrier for prospective technicians.
| Trend | Near-Term Impact (1–2 Yrs) | Long-Term Impact (3–5 Yrs) | Beneficiaries / Risk |
|---|---|---|---|
| ADAS Calibration | Higher severity, longer cycles | Revenue/repair up, volume down | Tech-equipped MSOs; liability risk for non-compliant shops |
| EV Proliferation | Hybrid surge; BEV growth uncertain | Mainstream; higher margins | Certified early movers; OEMs via vertical integration |
| AI Estimating | Efficiency gains, cost reduction | Margin compression for unequipped | Scale operators; tech vendors |
| OEM Certification | Differentiation & DRP access | Barrier to entry rises sharply | Certified shops; incumbent MSOs |
| Labor Shortage | Margin pressure on independents | Consolidation accelerator | Training-invested MSOs; technology that reduces tech hours |
| Parts Tariffs | Near-term cost inflation | Supply chain restructuring | Scale buyers; domestic recyclers |
| Axalta/AkzoNobel Merger | Pending ~late 2026/early 2027 | Supplier consolidation; pricing power shifts | Large MSOs with contract leverage; potential squeeze on independents |
Section 7: 2026 Outlook & Strategic Forecast
7.1 Revenue & Volume Expectations
The collision repair industry enters 2026 with cautious optimism. Cyclical pressures that weighed on 2025 revenues — mild weather, consumer deductible increases, and tariff shock — may partially normalize. The structural forces, however, remain directionally unchanged: fewer repairable claims, higher total-loss rates, and rising repair complexity. The net effect is expected to be modest revenue growth of 2.5–3.5% for well-positioned operators, with significant performance dispersion based on DRP relationships, OEM certifications, and geographic positioning.
2026 KEY QUESTION The critical question entering 2026: Are the volume declines of 2024–2025 cyclical or secular? The industry consensus increasingly suggests both — with cyclical stabilization possible in 2026, but long-term secular volume pressure from ADAS frequency reduction and total-loss dynamics remaining firmly in place. Operators that position for secular adaptation — rather than waiting for cyclical recovery — will emerge as the structural winners.
| Indicator | 2025 Actual | 2026 Forecast | Key Catalyst / Driver |
|---|---|---|---|
| U.S. Market Revenue | ~$46.2B | $47.5–$48.5B | Price/severity growth offsetting frequency decline |
| Total Loss Frequency | 23.1% | 23–24% | Continued vehicle complexity & value dynamics |
| ADAS Calibration Rate | 35.6% (Q3) | 35–40% | Increasing ADAS fleet penetration |
| Avg Repair Cost | $5,300+ | $5,500–$5,700 | Parts inflation, labor costs, complexity |
| M&A Transaction Volume | Moderate | Moderate-High | Seller return & stable buyer deployment |
| Active PE Platforms | 17 | 20+ | 3+ new entrants expected in 2026 |
| BEV Share of Claims | 3.21% | 3.0–3.5% | Tax credit expiry may slow BEV fleet growth |
| Technician Shortage Gap | ~100K positions | Persistent ~90–110K | Pipeline improving but structural gap persists |
7.2 M&A Outlook for 2026
Acquisition activity is broadly expected to increase in 2026 relative to the 2025 slowdown. Many operators who delayed an exit while waiting for revenue recovery are increasingly likely to revisit a sale, particularly as trailing twelve-month performance stabilizes, and buyers can underwrite forward projections with greater confidence.
- Valuation multiples are expected to hold or modestly recover as EBITDA stabilizes, rewarding high-quality MSOs with defensible DRP networks and OEM certifications
- At least three additional PE entrants are expected in 2026, intensifying competition for platform assets and supporting robust buyer demand across size tiers
- Mid-tier MSOs in the 10–50 shop range represent the most active deal zone — large enough for institutional capital, manageable in integration complexity
- Geographic coverage gaps (notably Southeast post-Gerber/JHC) are expected to drive targeted bolt-on acquisitions by Caliber and Crash Champions
- The USMCA joint review scheduled for July 1, 2026, adds near-term variable to parts-sourcing strategy, but is unlikely to halt deal activity
- The expected Axalta/AkzoNobel coatings merger in late 2026/early 2027 may reshape supplier dynamics for repairers, with significant purchasing power implications for large platform operators versus independents
7.3 Key Risk Watchpoints
| Risk Factor | Probability | Severity | Recommended Mitigation |
|---|---|---|---|
| USMCA renegotiation (July 2026) | High | High | Dual-source parts procurement strategy; domestic supplier relationships |
| Continued claims frequency decline | Medium-High | High | Market share capture via DRP deepening; OEM certification investment |
| Tariff expansion to sheet metal parts | Medium | High | Monitor Section 232 petition window; pre-tariff inventory builds on key parts |
| Technician shortage intensification | High | Medium-High | In-house training academies; apprenticeship programs; wage competitiveness |
| Consumer insurance rate shock / underinsured growth | Medium | Medium | Customer-pay service development; flexible payment solutions |
| EV market penetration acceleration / deceleration | Medium | Medium | Early EV certification investment; hybrid capability as intermediate hedge |
| Missed ADAS calibration liability | High | Medium-High | Calibration equipment investment; technician certification; liability audit protocols |
| PE exit cycle compression / market dislocation | Low-Medium | Medium | Diversified capital structure; organic growth buffer; conservative leverage |
Conclusion
The collision repair sector stands at a strategic inflection point. Near-term cyclical disruptions — tariff volatility, mild weather, and shifting consumer insurance behavior — overlay a longer-term structural narrative of fewer but more complex and valuable repairs. The industry's consolidation wave is not over; if anything, the Gerber-Joe Hudson's transaction may catalyze a new phase of large-scale combinations that further compresses the competitive landscape.
The evidence for secular change is compelling: ADAS calibration rates have nearly doubled in two years, EV repair complexity is elevating revenue per repair, and the workforce shortage is creating durable barriers to scale for undercapitalized operators. These forces are simultaneously compressing margins for independents and widening competitive moats for well-equipped MSOs with OEM certifications, training academies, and technology investments.
For operators, the imperatives are clear: invest in ADAS calibration capability (to capture revenue and limit liability), secure OEM certifications (to access premium DRP relationships), develop talent pipelines (to overcome the structural workforce shortage), and leverage technology (to reduce cycle times and improve supplement yields). For investors, the sector continues to offer a defensible, recession-resistant cash flow profile — with consolidation-driven scale advantages only widening the gap between leaders and laggards.
INVESTMENT THESIS The collision repair industry's long-term investment thesis remains intact: defensive cash flows, a fragmented market ripe for consolidation, and rising revenue per repair driven by vehicle technology complexity. The platforms that invest in ADAS, EV capability, and workforce development today will define the competitive landscape of 2030. At ~7x EBITDA, the market continues to offer attractive entry points for disciplined acquirers — particularly in the 10–50 shop mid-tier zone where platform formation opportunity is greatest.
Sources and Methodology
This report synthesizes publicly available industry data with Neo Advisory's own sector coverage. Market sizing, claims and repair-complexity figures are drawn from the sources below; location counts and transaction details are drawn from company announcements and trade press. Figures marked as estimates are our own and are identified as such.
- CCC Intelligent Solutions — Crash Course Q3 2025 and Crash Course Q4 2025: calibration and scan rates, total-loss frequency, repairable claim volume.
- Mordor Intelligence — North America Automotive Collision Repair Market: market sizing and growth forecast.
- Boyd Group Services — Completion of the Joe Hudson's Collision Center acquisition and PR Newswire release: transaction terms and location counts.
- Repairer Driven News — Scans and calibrations now routine at DRP shops and CCC report shows auto insurance market steadies in 2025.
- Autobody News — Calibrations surge past 35% of repairs and Boyd Group closes $1.3 billion acquisition.
- Additional context from Mitchell International, TechForce Foundation, PartsTrader, Insurify, CollisionWeek, and the Automotive Body Parts Association.
Prepared by John-Michael Tamburro, Founder, Neo Advisory.
This report is prepared for informational and publication purposes only. It does not constitute investment or financial advice. All figures are estimates and subject to revision, and forward-looking projections are inherently uncertain.