N## Executive Summary
Residential home services remains one of the most attractive lower-middle-market roll-up arenas in the U.S. because it sits at the intersection of non-discretionary demand, extreme fragmentation, and still-limited corporate penetration. The cleanest public proxy for the addressable market is owner-occupied improvement and maintenance spending. Harvard’s Joint Center for Housing Studies reported that the U.S. remodeling market remained above $600 billion through 2025 after jumping from $404 billion in 2019 to $611 billion in 2022, with replacement-heavy categories such as roofing, windows, and HVAC accounting for 49% of improvement expenditures in 2023 (Harvard JCHS).
KEY INSIGHT: Harvard’s LIRA forecast projects annual spending on improvements and maintenance to owner-occupied U.S. homes will reach $518 billion by the end of 2026, even as year-over-year growth slows from 2.1% mid-year to 1.6% by year-end (Harvard JCHS LIRA).
That deceleration matters, but it does not change the strategic logic for buyers. A slowing top line in the aggregate market tends to raise the relative value of businesses that already own service territories, trained technicians, maintenance-plan customers, and dispatch systems. In this sector, buyers are not underwriting blue-sky TAM expansion. They are underwriting density, call volume, financing-enabled replacement sales, and the ability to convert one-time repairs into recurring households.
For an owner-operator in Neo Advisory’s target range, the practical takeaway is simple: buyers do not pay a premium because a company is merely in HVAC, plumbing, electrical, or roofing. They pay for a specific operating profile. The businesses commanding the highest valuations have three characteristics. First, they skew toward repair-and-replacement rather than new construction. Second, they have repeatable customer acquisition and service-agreement infrastructure. Third, they can grow without the owner being the dispatch desk, lead closer, and senior technician all at once.
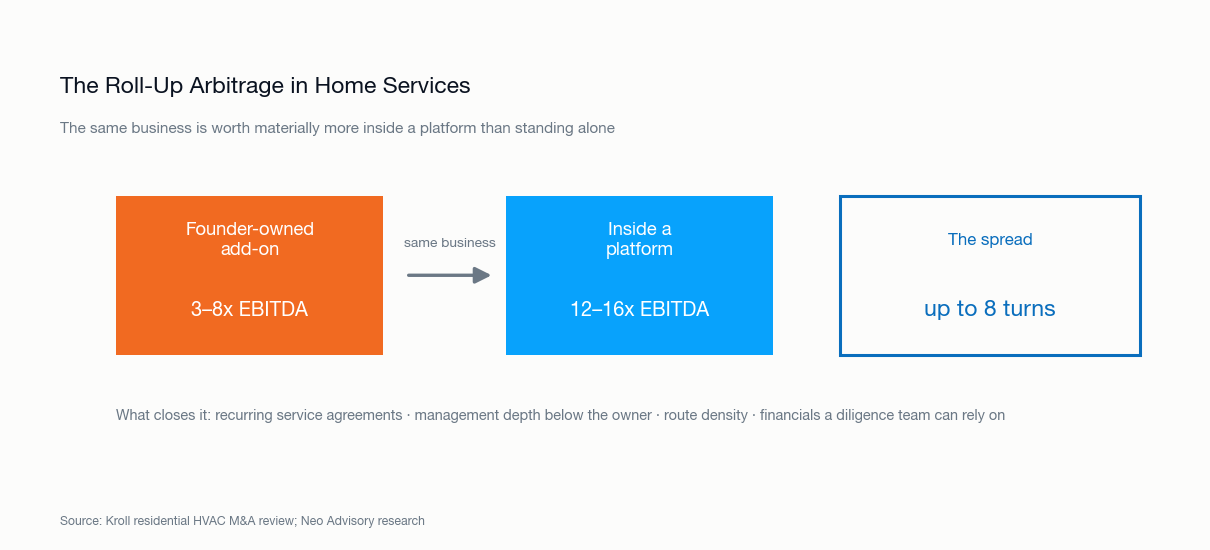
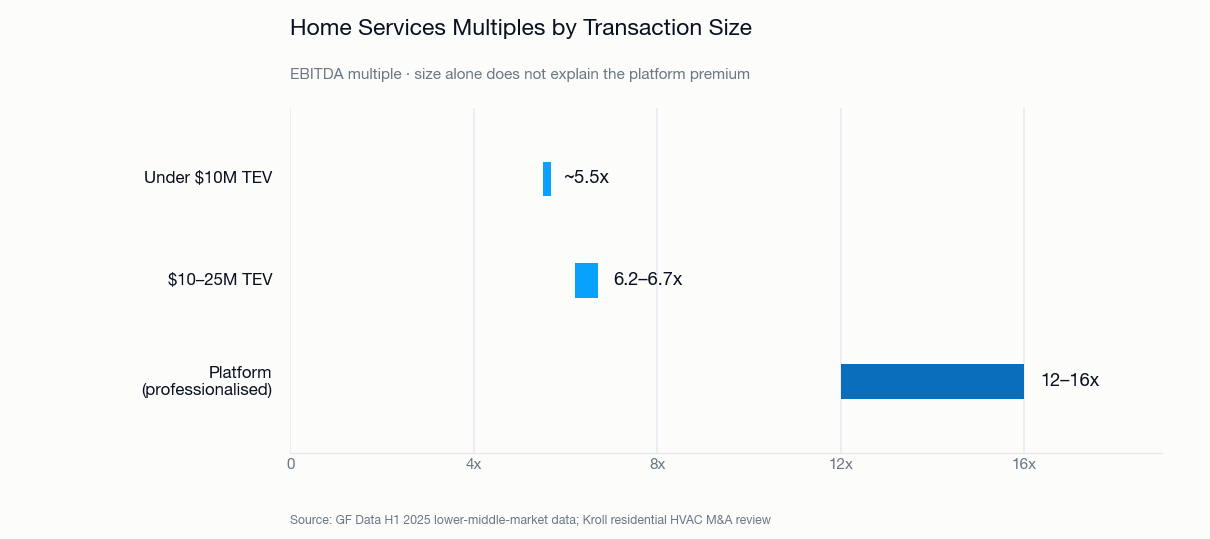
The multiple structure in 2025 made that distinction unusually clear. Kroll’s residential HVAC M&A review said smaller founder-owned add-ons often traded at roughly 3x to 8x EBITDA, while high-quality platforms with recurring revenue and professionalized infrastructure were still attracting mid-teens EV/EBITDA from private equity buyers (Kroll). GF Data’s H1 2025 lower-middle-market data showed that even outside a home-services-specific cut, very small private deals averaged about 5.5x to 5.6x EBITDA below $10 million TEV, while $10 million to $25 million TEV deals averaged 6.2x to 6.7x (GF Data). The spread between founder-owned tuck-ins and scaled platforms is the roll-up thesis in one sentence.
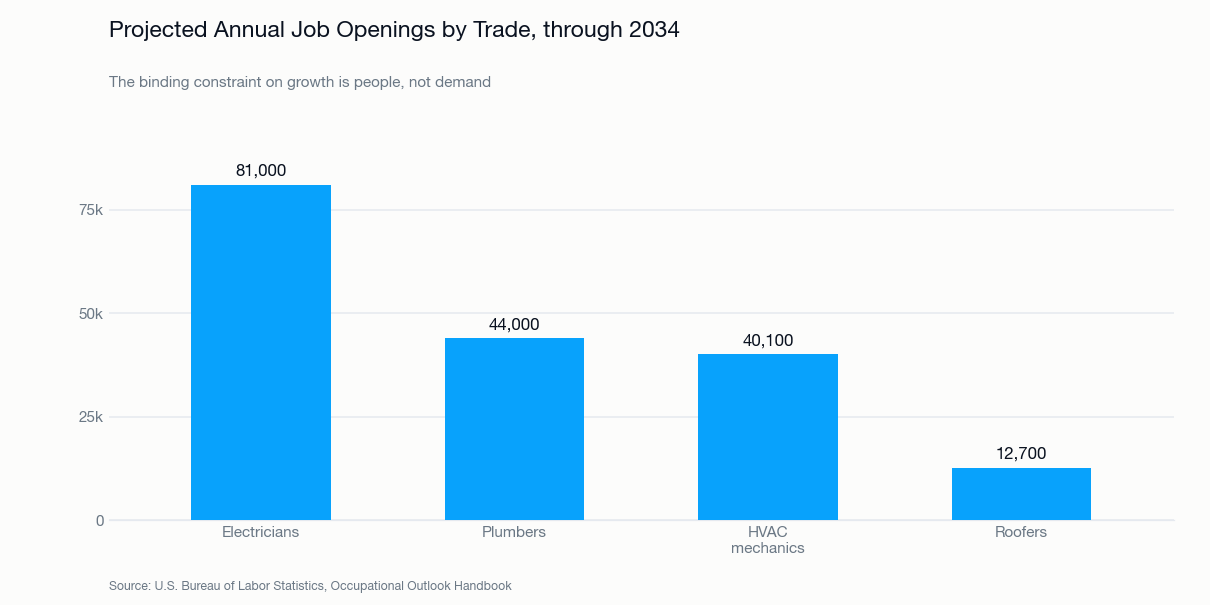
The sector’s biggest operating constraint is labor, not demand. Harvard reported that the remodeling industry remains highly fragmented and constrained by skilled-trade shortages, while immigrants accounted for a record 34% of the construction trades labor force in 2023 (Harvard JCHS). BLS projects average annual openings of 40,100 for HVAC mechanics, 44,000 for plumbers, 81,000 for electricians, and 12,700 for roofers through 2034 (BLS HVAC, BLS Plumbers, BLS Electricians, BLS Roofers). ABC separately estimated that the broader construction industry needed to attract 439,000 net new workers in 2025 and 349,000 in 2026 to meet demand (ABC 2025, ABC 2026).
The opportunity for sellers is that buyers know all of this. They know labor is tight, lead costs are rising, and housing turnover is muted. That is exactly why scaled residential service platforms are still drawing sponsor interest. In a market where homeowners are staying put longer and spending more on maintenance, the owner who can show sticky households, dense routing, multi-trade cross-sell, and a credible second layer of management is not just selling current EBITDA. They are selling a de-risked compounding machine.
Section 1: Market Overview
1.1 Market Size & Growth
Residential home services does not map perfectly onto one federal statistical series, because HVAC, plumbing, electrical, roofing, and adjacent maintenance live across multiple NAICS buckets. For valuation purposes, the most useful public market-size proxy is owner-occupied improvement and maintenance spending. On that basis, the market is undeniably large enough to support continued consolidation. Harvard’s JCHS said the U.S. remodeling market stayed above $600 billion through 2025, and the latest 2026 LIRA revision still projected $518 billion of annual owner spending by year-end 2026 despite softer growth (Harvard JCHS, Harvard JCHS LIRA).
That matters because the highest-value hard-trade categories sit inside the replacement-and-repair portion of that spend. Roofing, windows, and HVAC alone represented 49% of improvement expenditures in 2023 according to Harvard, which means the categories private equity is rolling up are already concentrated in the least discretionary part of the homeowner budget (Harvard JCHS).
Angi’s homeowner survey data tells the same story from the demand side. U.S. homeowners spent an average of $12,472 on home projects in 2025, up 3.5% from $12,050 in 2024; maintenance spending rose to $2,041 per household from $1,750, and emergency repair spending rose to $1,143 from $978 (Angi 2026 spending report). In the 2025 pulse survey, 71% of homeowners said they had postponed a planned home project, but the same 71% said they were focusing on preventative maintenance to avoid more expensive failures later (Angi pulse survey). That is exactly the behavioral setup that favors service-plan-based repair-and-replace businesses over design-led discretionary remodelers.
| Market size and demand snapshot | Figure | Why it matters |
|---|---|---|
| U.S. remodeling market level through 2025 | Above $600B | Confirms sector scale and durability (Harvard JCHS) |
| 2019 homeowner improvement and repair spend | $404B | Baseline before post-pandemic step-up (Harvard JCHS) |
| 2022 homeowner improvement and repair spend | $611B | Shows structural reset higher, not a minor cycle move (Harvard JCHS) |
| Projected end-2026 owner spending | $518B | Demand remains large even in a slowing environment (Harvard JCHS LIRA) |
| 2026 growth pace | 2.1% mid-year; 1.6% year-end | Growth is positive but normalizing (Harvard JCHS LIRA) |
| Share of 2023 improvement spend from replacement categories like roofing, windows, HVAC | 49% | Hard-trade categories sit in the most non-discretionary spend pool (Harvard JCHS) |
1.2 Industry Structure
This is still a local-market business masquerading as a national industry. Harvard’s 2025 housing report explicitly described the remodeling industry as highly fragmented, with large shares of self-employed contractors and small payroll companies even after a flurry of M&A (Harvard JCHS). KPMG makes the same point in roofing: the largest companies represent only about 6% of the market, leaving significant white space for consolidation (KPMG Roofing).
For owners, fragmentation cuts both ways. It keeps local reputation, routing density, and dispatch quality relevant, but it also means small businesses are competing against acquirers that bring centralized call centers, financing programs, paid-search budgets, technician recruiting, and M&A capital. The owner who still runs the business as a lifestyle asset is now competing with operators building mini-public-company infrastructure at the branch level.
The sector also splits naturally into two economic tiers. The first tier is the sub-scale local operator, often founder-led, with strong brand equity in one metro but weak back-office depth. The second is the platform or super-regional consolidator, which professionalizes lead generation, installs shared KPIs, and then buys density around a metro cluster. That operating difference is why a business can be worth 4x to 6x EBITDA as a standalone but contribute to a platform valued at 12x to 16x or more.
1.3 Demand Drivers
The first structural driver is the age of the housing stock. NAHB reported that 47% of owner-occupied homes were built before 1980 and that the median age of owner-occupied homes rose to 42 years in 2024, up from 31 in 2005 (NAHB). Older homes do not just create more projects; they create more unavoidable projects. Systems fail. Panels age out. Roofs wear. Water heaters leak. This is what supports the service-call base that PE likes.
The second driver is household “stay put” behavior. Angi found that in the 2025 pulse survey homeowners planned to stay in their homes an average of five years longer than originally expected, while 71% had delayed planned projects and shifted attention toward maintenance (Angi pulse survey). High mortgage-rate lock-in is not bullish for every housing-adjacent category, but it is bullish for replacement and upkeep.
The third driver is energy efficiency and weather resilience. Harvard reported that homeowners spent $139 billion on energy-related improvements in 2023, nearly four times the amount in 2003, while disaster repair spending rose to $49 billion in 2022-2023 from $16 billion in 2002-2003 (Harvard JCHS). That directly benefits HVAC electrification, panel upgrades, backup-power work, roofing resilience products, and storm-response exterior contractors.
| Demand driver | Public evidence | Implication for acquirers |
|---|---|---|
| Aging homes | Median owner-occupied home age reached 42 years in 2024; 47% built before 1980 (NAHB) | More replacement demand, better call frequency |
| Homeowner maintenance bias | 71% focused on preventative maintenance in 2025 (Angi pulse survey) | Better service-plan conversion opportunity |
| Rising maintenance budgets | Per-household maintenance spend rose to $2,041 in 2025 (Angi 2026 spending report) | Supports repair-ticket volume even in a softer economy |
| Energy-efficiency investment | $139B spent on energy-related improvements in 2023 (Harvard JCHS) | Benefits heat pumps, electrical upgrades, insulation-linked trades |
| Disaster and climate repair | Disaster repairs reached $49B in 2022-2023 (Harvard JCHS) | Favors roofing and storm-response markets in high-risk geographies |
Section 2: Key Industry Metrics
If an owner asks what actually drives enterprise value in residential home services, the answer is not revenue size by itself. Buyers look first at revenue quality, gross-margin profile, technician utilization, and the repeatability of customer acquisition.
Service agreement penetration matters because it converts a weather-sensitive, one-call business into a routable customer base. Kroll identified maintenance plans and membership programs as a central reason private equity keeps paying premium valuations in residential HVAC, along with multitrade bundles and technology-enabled operations (Kroll). Blackstone’s 2026 acquisition announcement for Champions Group underscored the same point, highlighting more than 150,000 active members across the platform as part of the investment thesis (Blackstone).
Public market trading data shows why buyers chase this model. KPMG’s August 31, 2025 home services comp sheet showed residential non-franchise services trading at a mean 11.4x LTM EBITDA and a mean 2.57x LTM revenue, while the broader home services sector mean was 15.7x EBITDA (KPMG Home Services). Those are public-market valuations, not branch valuations, but they set the reference point that informs sponsor underwriting.
| Key metric | Latest public figure | Why buyers care |
|---|---|---|
| Avg. homeowner spend on all home projects in 2025 | $12,472 | Measures addressable wallet share per household (Angi 2026 spending report) |
| Avg. maintenance spend per household in 2025 | $2,041 | Better proxy for recurring repair demand (Angi 2026 spending report) |
| Avg. emergency repair spend per household in 2025 | $1,143 | Confirms non-deferrable call volume (Angi 2026 spending report) |
| Replacement project share of 2023 improvement expenditures | 49% | Hard trades sit in the essential end of spend (Harvard JCHS) |
| Mean public EV/LTM EBITDA, residential non-franchise services | 11.4x | Benchmark for scaled, institutionalized assets (KPMG Home Services) |
| Champions Group active members at Blackstone signing | 150,000+ | Membership density supports valuation premium (Blackstone) |
The second metric family is labor. Wage levels matter, but opening counts matter more because they show the replacement burden the sector must absorb before it can even grow. The median annual wage was $59,810 for HVAC mechanics, $62,970 for plumbers, $62,350 for electricians, and $50,970 for roofers in May 2024, with projected annual openings far above net growth needs because the sector is replacing retirees and churn as much as it is adding headcount (BLS HVAC, BLS Plumbers, BLS Electricians, BLS Roofers).
| Trade labor metrics | Median annual wage | Projected annual openings | 2024-2034 growth |
|---|---|---|---|
| HVAC mechanics/installers | $59,810 | 40,100 | 8% |
| Plumbers/pipefitters/steamfitters | $62,970 | 44,000 | 4% |
| Electricians | $62,350 | 81,000 | 9% |
| Roofers | $50,970 | 12,700 | 6% |
Source: BLS HVAC, BLS Plumbers, BLS Electricians, BLS Roofers
The third metric family is valuation. This is where owners tend to misread the market. They hear about a marquee sponsor-to-sponsor platform trade and assume the same multiple applies to a branch business that still depends on the founder. It does not. The market is paying for platform attributes.
| Valuation ladder | Public evidence | What it usually represents |
|---|---|---|
| ~3x-8x EBITDA | Smaller tuck-ins in residential HVAC often trade in this range (Kroll) | Founder-led add-ons, often single-market and owner-dependent |
| ~5.5x-5.6x EBITDA | H1 2025 GF Data average for $1M-$10M TEV deals (GF Data) | Very small lower-middle-market transactions |
| ~6.2x-6.7x EBITDA | H1 2025 GF Data average for $10M-$25M TEV deals (GF Data) | Better scaled LMM deals, often still sub-platform |
| ~11.4x EBITDA | Mean public EV/LTM EBITDA for residential non-franchise services at 8/31/25 (KPMG Home Services) | Institutionalized, diversified public comps |
| Mid-teens EBITDA | High-quality residential HVAC platforms per Kroll (Kroll) | Sponsor-backed regional or national platforms with recurring revenue |
| 11.8x EBITDA median | 2025 HVAC/R transaction median in Seale’s annual report (Seale & Associates) | Broader HVAC/R M&A set, useful as an upper-market reference point |
For a seller, the implication is straightforward. If the exit plan is “sell the branch as a branch,” valuation will likely be anchored closer to the lower-middle-market or add-on range. If the exit plan is “build a branch that a platform can absorb with minimal disruption and obvious cross-sell upside,” the same business often gets a meaningfully better outcome.
Section 3: The Operating Environment
The operating environment has become more complex, not less. The first force is labor scarcity. Harvard reported that a majority of remodelers saw shortages of carpenters, electricians, and plumbers between 2015 and 2023, and that immigrants made up a record 34% of construction trades labor in 2023 (Harvard JCHS). That means recruiting, apprenticeship pipelines, immigration exposure, and retention bonuses are no longer HR footnotes. They are throughput constraints.
The second force is regulatory and product transition in HVAC. EPA’s technology transition rules bar certain high-GWP HFCs in specified equipment categories beginning January 1, 2025, while allowing pre-2025 inventory to be installed until January 1, 2026 (EPA technology transitions, EPA HFC restrictions). The owners who handled that refrigerant transition well protected close rates and installer productivity. The owners who did not spent 2025 explaining product changes, managing inventory friction, and retraining crews.
The third force is incentives. ENERGY STAR states that qualifying air-source heat pumps remain eligible for a federal tax credit worth 30% of cost up to $2,000, and DOE summarizes total annual home energy-efficiency credits up to $3,200 when heat pumps are combined with other qualifying upgrades (ENERGY STAR heat pumps, DOE home upgrades). That does not make every contractor an electrification winner, but it does shift homeowner conversations toward system replacement, financing, and bundled upgrades.
The fourth force is customer acquisition economics. Home services has become a digital auction as much as a field-service business. LocaliQ’s 2025 benchmarks showed average home-services paid-search CPC at $7.85 and average CPL at $90.92, with electricians at $93.69 CPL, plumbing at $129.02, and roofing and gutters at $228.15 (LocaliQ). Google’s own Local Services Ads product is explicitly pay-per-lead rather than pay-per-click and requires screening and verification (Google Local Services Ads). That sounds tactical, but it is really structural: the businesses with stronger review volume, call handling, CRM follow-up, financing, and membership conversion are buying the same lead more profitably than weaker peers.
| Operating constraint | Public signal | Value implication |
|---|---|---|
| Skilled-labor shortage | Majority of remodelers reported shortages from 2015-2023; immigrants were 34% of trades labor in 2023 (Harvard JCHS) | Recruiting engine becomes a valuation asset |
| Refrigerant transition | EPA restrictions on certain high-GWP HFC technologies started 1/1/25 (EPA) | Training and inventory discipline separate strong operators |
| Electrification incentives | Up to $2,000 federal tax credit for qualifying heat pumps (ENERGY STAR) | Can lift replacement close rates and average tickets |
| Paid search inflation | Avg. home-services CPL $90.92; roofing/gutters $228.15 (LocaliQ) | Poor lead handling compresses EBITDA quickly |
| Google LSA structure | Pay-per-lead model with verification (Google) | Review hygiene and conversion speed matter more |
Section 4: Competitive Landscape
The buyer universe is now deep enough that sellers should think in tiers, not one generic “PE buyer” bucket. At the top are scaled PE-backed platforms and strategic consolidators with formal corp-dev teams. Below them are emerging regionals still building density. Below them are first-time platform sponsors or trade-specific consolidators in roofing and exterior services.
Wrench Group remains one of the most visible scaled platforms, operating in 26 markets across 15 states and serving more than 2 million customers annually with more than 7,300 team members according to its website (Wrench Group). Redwood Services said in 2024 that it had 19 partner companies and later described itself as focused on 100% residential, non-new-construction HVAC, plumbing, and electrical businesses (Redwood 19th partner, Redwood). Sila Services said it operated 19 brands across 25 company locations in the Northeast, Mid-Atlantic, and Midwest (Sila Services). TurnPoint said it operates in more than 30 states (TurnPoint, TurnPoint SB 261 report). Southern Home Services’ website lists operations across 11 states (Southern Home Services). Ace Hardware Home Services, meanwhile, is the clearest example of a strategic consumer brand entering the same consolidation lane, with home-services operations across multiple states and legacy Ace Handyman coverage in 47 states (Ace Hardware Home Services, Ace locations).
| Major consolidators and strategics | Backing / owner | Public footprint signal | Focus |
|---|---|---|---|
| Wrench Group | Leonard Green + TSG + Oak Hill backing disclosed previously | 26 markets, 15 states, 7,300+ team members, 2M+ customers annually (Wrench Group) | HVAC, plumbing, electrical, water |
| Champions Group | Acquired by Blackstone in 2026 | 1,800+ field technicians, 150,000 active members (Blackstone) | Residential HVAC, plumbing, electrical |
| Sila Services | Goldman Sachs Alternatives | 19 brands, 25 locations (Sila Services) | HVAC, plumbing, electrical |
| Redwood Services | Altas Partners + Union Main Group | 19 partner companies in 2024; 100% residential non-new-construction focus (Altas/Redwood, Redwood) | HVAC, plumbing, electrical |
| TurnPoint Services | Private, sponsor-backed | More than 30 states (TurnPoint) | HVAC, plumbing, electrical, broader field services |
| Southern Home Services | Private, sponsor-backed | 11 states on current site footprint (Southern Home Services) | HVAC, plumbing, electrical |
| Ace Hardware Home Services | Strategic | 800+ experts in 2023 launch phase; handyman services in 47 states; current service locations across multiple states (Ace Hardware Home Services, Ace locations) | HVAC, plumbing, electrical, handyman, painting |
| Apex Service Partners | Alpine Investors-backed platform | Nationwide residential service strategy described by company (Apex) | HVAC, plumbing, electrical |
The competitive reality for a local owner is that these acquirers are not merely aggregating revenue. They are competing on technician recruiting, financing, digital lead flow, tuck-in M&A, and cross-trade conversion. That means the best defense for an independent company is to become the strongest local asset in a desirable metro, not to remain generically “family owned.”
Section 5: M&A Activity & Deal Flow
Home services deal flow in 2025 was active enough to prove the thesis, but selective enough to reward quality. KPMG’s home services market update showed announced transaction volume rising 38.6% from Q1 to Q2 2025, while announced transaction value increased from $0.5 billion to $2.7 billion quarter over quarter (KPMG Home Services). In HVAC specifically, Hyde Park Capital’s spring 2025 report showed U.S. HVAC services M&A volume had run from 86 deals in 2019 to 219 in 2022 before cooling to 133 in 2024, still well above pre-roll-up levels (Hyde Park HVAC). Roofing followed a similar pattern: Hyde Park reported 53 roofing transactions in 2024 versus 7 in 2018, while KPMG described the market as highly fragmented despite robust recent consolidation (Hyde Park Roofing, KPMG Roofing).
The clearest lesson from 2025 activity is that private equity still has capital and conviction, but not for undifferentiated assets. Bain said global buyout dry powder stood at $1.3 trillion heading into 2026, with 2025 global buyout deal value rising 44% year over year to $904 billion (Bain). That macro liquidity supports home services, but it does not erase underwriting discipline.
| Selected 2025 hard-services transactions | Date | Target | Buyer | Disclosed value / multiple |
|---|---|---|---|---|
| Progressive Services | Jul-25 | Progressive Services | TopBuild | $810M at 1.85x revenue and 9.1x EBITDA (KPMG Home Services) |
| Restivos Heating & Air Conditioning | Aug-25 | Restivos Heating & Air Conditioning | Liberty Service Partners / NorthCurrent | Not disclosed (KPMG Home Services) |
| Southside Plumbing Co. | Aug-25 | Southside Plumbing Co. | Kingsway Financial Services | $7M disclosed EV, multiple not disclosed (KPMG Home Services) |
| Master Plumbers Heating and Cooling | Mar-25 | Master Plumbers Heating and Cooling | Leap Service Partners | Not disclosed (Hyde Park HVAC) |
| Sullivan Super Service | Jan-25 | Sullivan Super Service | Sila Services | Not disclosed (Hyde Park HVAC) |
| Thomas Jefferson Roofing & Remodeling | Jun-25 | Thomas Jefferson Roofing & Remodeling | Mister Quik Home Services | Not disclosed (Hyde Park Roofing) |
| Ridge Top Exteriors | Jun-25 | Ridge Top Exteriors | TrussPoint Roofing & Exterior Renovations / Soundcore | Not disclosed (Hyde Park Roofing) |
| Adam Vaillancourt Roofing | Jan-25 | Adam Vaillancourt Roofing | Canopy Services / Trivest | Not disclosed (Hyde Park Roofing) |
At the platform level, 2025 also reinforced how large the best assets had become. Kroll said Sila Services’ sale from Morgan Stanley Capital Partners to Goldman Sachs Alternatives in early 2025 was reportedly valued at about $1.5 billion including debt, and Reuters reporting carried by Yahoo said the transaction could value Sila at about that level (Kroll, Yahoo/Reuters). Whether one uses the low or high end of the reported range, the message is the same: scaled residential HVAC/plumbing/electrical platforms have matured into true sponsor-to-sponsor assets.
This is the platform-and-add-on model in practice. Sponsors buy a platform with management, recruiting, call-center, CRM, and lender relationships. They then acquire founder-owned add-ons at materially lower multiples, integrate routing and marketing, cross-sell trades, and eventually sell the larger basket at a public-comp-informed or sponsor-to-sponsor multiple. That is not financial engineering in the abstract. It is operational arbitrage plus multiple arbitrage.
Section 6: Emerging Trends & Disruptions
The first trend is the shift from single-trade to bundled household relationships. Buyers increasingly prefer HVAC-plus-plumbing-plus-electrical models because the household acquisition cost is incurred once but monetized repeatedly. Kroll called out multitrade capabilities as a reason platforms continue to trade actively, and buyers such as Champions, Wrench, Apex, Redwood, and Southern all market multi-trade offerings rather than narrow single-service identities (Kroll, Wrench Group, Apex).
The second is the institutionalization of software. The software itself is rarely the moat; the workflow it enables is. Kroll noted that platforms are focusing on businesses with upgraded dispatch, mobile invoicing, and modern diagnostic tools because those systems improve productivity, margins, and scalability (Kroll). In practice, that means faster booking, better technician routing, higher close-rate visibility, tighter membership renewal tracking, and more financeable replacement sales.
The third is that customer acquisition is becoming less forgiving. LocaliQ’s data showed roofing and gutters carrying the highest paid-search CPL at $228.15 and one of the lowest conversion rates at 3.70%, while HVAC and plumbing both sat around $129 CPL in paid search (LocaliQ). In plain English: a weak dispatcher, poor review profile, or slow call-back speed can now destroy marketing ROI far faster than many independent operators realize.
The fourth is electrification and resilience. Heat pumps, panel upgrades, IAQ, backup-power work, and weather-driven roofing replacements are not fringe adjacencies anymore. They are margin and valuation adjacencies. Owners who can show they are already monetizing those demand shifts will get more buyer attention than owners who merely promise they could.
Section 7: 2026 Outlook & Strategic Forecast
The 2026 outlook is best described as slower growth, firm demand, and selective M&A. Harvard’s revised January 2026 LIRA expects owner spending to hit $518 billion by year-end 2026, but only at 1.6% year-over-year growth by the end of the year (Harvard JCHS LIRA). This is not a collapse. It is a normalization phase. The businesses that suffer most in that environment are the ones that depended on easy volume or the owner’s charisma. The businesses that still trade well are the ones that can prove repeatability.
For M&A, capital availability is not the bottleneck. Bain’s $1.3 trillion global buyout dry powder figure says buyers still need places to deploy capital (Bain). The bottleneck is investable quality. In this market, buyers want evidence of route density, management depth, service-agreement traction, and disciplined lead handling. They are much less willing to underwrite “figure it out after close” stories for small founder-owned businesses than they were when debt was cheaper.
| 2026 outlook dashboard | Base view | What owners should do now |
|---|---|---|
| Revenue demand | Positive but decelerating | Defend close rates and membership retention, not just lead volume |
| Labor | Still the binding constraint | Build recruiting, apprenticeships, and supervisor bench |
| Marketing | Paid leads remain expensive | Measure call answer rate, booking rate, and financed close rate weekly |
| M&A | Active for quality assets | Clean financials and articulate the post-owner operating model |
| Valuation | Wide spread between add-ons and platforms | Improve recurring revenue, second-line management, and multi-trade cross-sell |
| Risk watchpoints | Tariffs, rates, labor, insurance, weather volatility | Reprice quickly, monitor gross margin by trade and by install type |
For a $3 million to $50 million revenue owner, the most important strategic question is not “Should I sell in 2026 or wait until 2028?” The question is “Will my business be demonstrably more platform-ready in two years than it is today?” If the next two years produce higher maintenance-plan penetration, stronger dispatcher productivity, deeper technician bench, cleaner financial reporting, and less owner dependence, waiting can create real value. If those two years mostly produce more fatigue, more complexity, and no second layer of management, the business may simply be older when it comes to market, not better.
Neo Advisory's View
The analysis above is deliberately evidence-led. What follows is our opinion on what it means for an owner, informed both by that evidence and by direct conversations with operators and acquirers working in these trades. We have separated it so a reader can accept the data and reject the conclusion.
1. The multiple gap is not a size premium. It is an acquirability premium — and most of it is closable.
The spread between founder-owned tuck-ins at roughly 3x to 8x EBITDA and professionalized platforms at mid-teens is the most important number in this sector, and it is widely misread. Owners tend to interpret it as a reward for scale, and therefore as unreachable. It is not primarily about scale. It is about whether a buyer can operate the business without the seller in it.
Technician recruitment and retention that works without the owner. Service calls that convert to membership agreements at a measurable rate. A second layer of management that makes decisions. Financial presentation a diligence team can rely on. Those four things are what separate the multiple classes, and none of them requires becoming a large company.
Our stance: for most owner-operators in this sector, 18 to 24 months of deliberate preparation moves the business between multiple classes rather than up within one. That is a different order of value creation than any operational improvement available in the same period.
2. Decelerating market growth favors the right sellers. This is counterintuitive and it matters.
Harvard's LIRA forecast shows growth easing from 2.1% mid-2026 to 1.6% by year-end. The instinct is to read that as a reason to wait for better conditions.
We think that reads the buyer wrong. When aggregate market growth slows, sponsors stop underwriting blue-sky expansion and start underwriting density, retention and route economics — which is precisely what an established operator with service territory and a membership base already owns. Slowing growth increases the relative value of incumbency.
The corollary is uncomfortable but worth stating: waiting for the market to accelerate is likely to be waiting for conditions that would favor a buyer's alternative uses of capital, not your sale.
3. Labor scarcity is a valuation asset, and owners systematically fail to present it.
BLS projects average annual openings of 40,100 for HVAC mechanics, 44,000 for plumbers, 81,000 for electricians and 12,700 for roofers through 2034. ABC estimates the broader construction industry needed 439,000 net new workers in 2025.
Every buyer in this sector knows labor is the binding constraint on growth. A business that has demonstrably solved recruitment and retention — measurable tenure, a working apprenticeship pipeline, turnover below sector norms — owns something a buyer cannot acquire any other way and cannot build quickly.
Yet almost no seller presents workforce data in a sale process with the rigor they apply to financial data. Operators tell us the same thing repeatedly: the recruitment and retention pipeline they built because they had no other option is the one thing they never think to put in front of a buyer. This is the most under-exploited valuation argument in home services, and it costs nothing to prepare beyond assembling numbers the business already has.
4. Recurring revenue is the single highest-return pre-sale action available.
Converting transactional customers into service agreements does two things, and only one of them is obvious. It lifts EBITDA, which is the visible effect. Less visibly, it changes what kind of asset the business is: from a company that must win each year's revenue to one that begins each year with a contracted base and a replacement pipeline attached to known households.
Buyers price those as different asset classes, not as the same asset with different numbers. Of everything we discuss with owners in these trades, this is the change that most reliably alters the outcome. An owner with 18 months before a sale and one initiative to pursue should pursue this one.
5. Be clear-eyed about whose arbitrage you are selling into.
A business worth 4x to 6x standalone can contribute to a platform valued at 12x to 16x. That spread does not disappear at closing — it accrues to the sponsor who assembles the platform.
This is not an argument against selling. Roll-up arbitrage is a legitimate return on genuine integration work, and most owner-operators have neither the capital nor the appetite to capture it themselves. But an owner should enter the process knowing the number, because it explains why a buyer can pay more than the business appears to be worth on its own — and why leaving that value entirely uncontested in the negotiation is a choice rather than an inevitability.
Conclusion
Residential home services is still a seller-relevant M&A market, but it is not a market that rewards every seller equally. The broad macro case remains compelling: the housing stock is old, homeowners are staying put, replacement-heavy trades capture nearly half of improvement expenditures, and private equity still has capital to deploy. The micro case is more demanding. Buyers are paying platform prices only for businesses that already look like building blocks of a larger platform.
That distinction is where Neo Advisory can create value for founder-led businesses. The businesses most likely to command a premium are not necessarily the largest. They are the ones that can prove repeatability. A buyer wants to see that technicians can be recruited and retained, that service calls turn into memberships, that memberships turn into replacement revenue, and that all of it can happen without the owner personally touching every decision.
For owners deciding whether to sell now or in two years, the answer is not ideological. Sell now if the business is already premium-positioned and the owner’s energy is no longer the scarce resource to deploy. Wait if there is a realistic, measurable path to stronger recurring revenue, denser routing, better management depth, and cleaner financial presentation. In this sector, those improvements do not just lift EBITDA. They change the multiple class the business can access.
Sources and Methodology
- Harvard Joint Center for Housing Studies: Remodeling Soars to New Heights, but Industry Struggles to Address Labor Shortages and Urgent Needs for Energy Efficiency and Disaster Resilience
- Harvard Joint Center for Housing Studies: Remodeling Growth Set to Downshift in Late 2026
- NAHB: How Old is Today's Housing Stock?
- Angi: Millennials Are Driving the Future of Home Spending, According to Angi’s State of Home Spending Report
- Angi: 2025 State of Home Spending Pulse Report
- BLS Occupational Outlook Handbook: Heating, Air Conditioning, and Refrigeration Mechanics and Installers
- BLS Occupational Outlook Handbook: Plumbers, Pipefitters, and Steamfitters
- BLS Occupational Outlook Handbook: Electricians
- BLS Occupational Outlook Handbook: Roofers
- Associated Builders and Contractors: Construction Industry Must Attract 439,000 Workers in 2025
- Associated Builders and Contractors: Construction Industry Must Attract 349,000 Workers in 2026 Despite Macroeconomic Headwinds
- KPMG Corporate Finance: Home Services Industry Update Fall 2025 PDF
- KPMG Corporate Finance: Roofing Contracting: M&A Market Update 2025
- Kroll: M&A in the Residential HVAC Services Industry and What’s Driving Growth
- GF Data: Small-Deal Resilience: Why the Under $25 Million Tier Still Moves in H1 2025
- Seale & Associates: 2025 Annual HVAC/R Report
- Hyde Park Capital: HVAC Services Market Insights Spring 2025
- Hyde Park Capital: Roofing Services Market Insights Summer 2025
- Bain & Company: Private Equity Resurgence Gathers Steam as New Era Challenges Firms to Enhance Value Creation
- EPA: Regulatory Actions for Technology Transitions
- EPA: Technology Transitions HFC Restrictions by Sector
- ENERGY STAR: Air Source Heat Pumps Tax Credit
- Department of Energy: Home Upgrades
- LocaliQ: 2025 Search Ad Benchmarks for Home Services
- Google Ads: Local Services Ads
- Wrench Group Overview
- Redwood Services Announces Strategic Investment from Altas Partners
- Redwood Services Home Page
- Redwood Services Announces 19th Partnership With Guaranteed Service
- Sila Services Acquires Central Cooling & Heating, Inc.
- TurnPoint Services Careers in the Trades
- TurnPoint Services Climate-Related Financial Risk Report
- Southern Home Services
- Ace Hardware Home Services: Who is Ace Hardware Home Services
- Ace Hardware Home Services Locations
- Apex Service Partners: Our Vision
- Blackstone Announces Agreement to Acquire Champions Group
- Yahoo Finance / Reuters: Morgan Stanley’s PE arm to sell HVAC firm Sila to Goldman Sachs Alternatives