Executive Summary
The U.S. convenience and fuel retail sector enters 2026 in an unusual position: operationally healthy, structurally fragmented, and consolidating faster at the top than at any point in the last decade — while the majority of its operators remain single-store owners with no succession plan.
The headline numbers are strong. In-store sales reached $341.2 billion in 2025, the twenty-third consecutive year of growth (NACS). Fuel margins averaged more than 40 cents per gallon, historically elevated. But the composition of profit has shifted decisively, and that shift is the single most important fact for any owner contemplating a sale. Fuel now accounts for 65.0% of sales dollars but only 38.8% of gross profit. Foodservice accounts for 28.5% of in-store sales and 38.9% of in-store gross profit (NACS). Buyers are no longer purchasing fuel volume. They are purchasing inside-store gross profit, and they price the two very differently.
KEY INSIGHT U.S. convenience in-store sales reached $341.2 billion in 2025 — the twenty-third straight year of growth — but fuel now delivers 65% of sales dollars and only 39% of gross profit, while foodservice delivers 28% of sales and 39% of gross profit. The buyer universe has repriced accordingly: strategic acquirers are paying for foodservice-capable sites and discounting fuel-dependent ones.
Consolidation accelerated sharply in 2025. Alimentation Couche-Tard closed its $1.57 billion acquisition of GetGo Café + Market, adding roughly 270 locations (C-Store Dive). Casey's General Stores acquired 198 CEFCO stores for $1.15 billion, pushing its network past 2,900 locations. Sunoco sold 200 stores to 7-Eleven for approximately $1 billion and agreed to acquire Parkland Corporation for $9.1 billion. Couche-Tard's roughly $40 billion approach to Seven & i Holdings collapsed in June, after which Seven & i reaffirmed plans for a North American 7-Eleven IPO and 1,300 new stores by 2030.
Yet the acquisition mathematics at the small end tells a different story. Capstone Partners reports that convenience store acquisition multiples averaged 10.1x in year-to-date 2025, while the median store count per transaction fell from 13 to eight (Capstone Partners). Buyers are doing more deals, for fewer stores each. That is the signature of a market where the large platforms have already bought the obvious targets and are working down into smaller operators — which is precisely the window in which a well-prepared single-store or small-chain owner can transact at a premium to historical norms.
For the owner of a three-to-fifteen store chain, the strategic question in 2026 is not whether buyers exist. It is whether the business is structured so that a buyer can underwrite it — separable real estate, clean fuel supply agreements, documented inside-store margins, and a foodservice program that survives the transition. Businesses that clear those bars are transacting near double-digit store-level EBITDA multiples. Businesses that do not are being valued as fuel volume with a building attached, at roughly half that.
Section 1: Market Overview
1.1 Market Size & Growth
The U.S. convenience channel comprises 152,255 stores as of early 2025, of which 60% are single-store operators (NACS). This is the defining structural fact of the sector. No other retail channel of comparable scale remains so heavily owner-operated, and it is the reason consolidation has run for three decades without exhausting the supply of targets.
In-store sales — merchandise plus foodservice, excluding fuel — reached $341.2 billion in 2025, up 1.7% from $335.5 billion in 2024. That marks the twenty-third consecutive year of in-store sales growth, a streak that spans two recessions and a pandemic (NACS).
| Metric | 2024 | 2025 | Change |
|---|---|---|---|
| In-store sales (merchandise + foodservice) | $335.5B | $341.2B | +1.7% |
| Consecutive years of in-store growth | 22 | 23 | — |
| Total U.S. store count | ~152,000 | 152,255 | Flat |
| Single-store operators as share of count | ~60% | 60% | Flat |
| Average fuel margin | — | >40 cents/gal | Historically elevated |
The flat store count against rising sales is significant. The channel is not expanding by unit; it is expanding by productivity per unit. That has two consequences for valuation. First, a buyer acquiring stores is acquiring share in a fixed-size network rather than participating in unit growth, which raises the strategic value of well-located sites. Second, underperforming sites have no growth tailwind to hide behind, and buyers underwrite them accordingly.
1.2 Industry Structure
The channel divides into four tiers, and each transacts on materially different terms.
| Tier | Approximate profile | Typical buyer | Transaction dynamics |
|---|---|---|---|
| National consolidators | 2,000+ stores (Couche-Tard, 7-Eleven, Casey's, Murphy USA) | Public markets, cross-border strategics | Platform-scale M&A, antitrust scrutiny, divestiture packages |
| Large regional chains | 200–2,000 stores | Strategic acquirers, large PE | Full auction processes, competitive tension, premium multiples |
| Small chains | 3–200 stores | Regional strategics, PE add-ons, family offices | The active consolidation zone; most transactions occur here |
| Single-store operators | 1–2 stores | Individual buyers, small franchisees, local operators | Typically SDE-based rather than EBITDA-based valuation |
Neo Advisory's client is concentrated in the third tier, and the reason matters. Single-store businesses are generally valued on seller's discretionary earnings — commonly cited in the range of 2.0x to 3.5x SDE, or roughly 3.5x to 5.5x EBITDA depending on location quality, fuel margin stability and operational consistency (Peak Business Valuation). Once an operator crosses into a genuine multi-site platform with corporate overhead, documented systems and separable management, the buyer universe changes entirely — and so does the multiple.
That transition, from "a job with real estate attached" to "an acquirable platform," is the single largest value-creation lever available to an owner in this sector, and it is almost always underexploited.
1.3 Demand Drivers
Four forces underpin channel demand, and their relative weight has shifted materially.
Immediate consumption. The channel's core proposition is speed and proximity, which is structurally defensible against e-commerce in a way that most retail formats are not. This is the foundation of the twenty-three-year in-store growth streak.
Foodservice substitution. Prepared food at convenience stores now competes directly with quick-service restaurants on price and convenience. Foodservice contributes 38.9% of in-store gross profit from 28.5% of in-store sales, a margin profile no other category matches at scale.
Fuel as traffic driver, not profit center. Fuel remains essential for footfall but has become a declining share of economics. At 65.0% of sales dollars and 38.8% of gross profit, its role has inverted from what it was two decades ago.
Nicotine decline, partially offset. The nicotine category is projected to decline 4–5% in 2025, with cigarettes losing 1.8 share points to 55.7% of nicotine volume. Modern oral nicotine is projected to grow 35–45%, at higher margin (Convenience Store News). For a buyer, a store with heavy cigarette dependence is a store with a declining revenue base and a customer cohort that is shrinking.
Section 2: Key Industry Metrics
The economics that determine value in this sector are not the economics most owners track. Fuel gallons and total revenue are the headline numbers operators quote; inside gross profit dollars and foodservice penetration are the numbers buyers underwrite.
2.1 The Profit Inversion
| Revenue source | Share of sales dollars | Share of gross profit dollars | Implication for valuation |
|---|---|---|---|
| Fuel | 65.0% | 38.8% | High revenue, low and volatile margin — discounted by buyers |
| Foodservice | 28.5% of in-store sales | 38.9% of in-store gross profit | Highest-value earnings stream; drives premium multiples |
| Merchandise (incl. nicotine) | 71.5% of in-store sales | 61.1% of in-store gross profit | Stable but with declining nicotine drag |
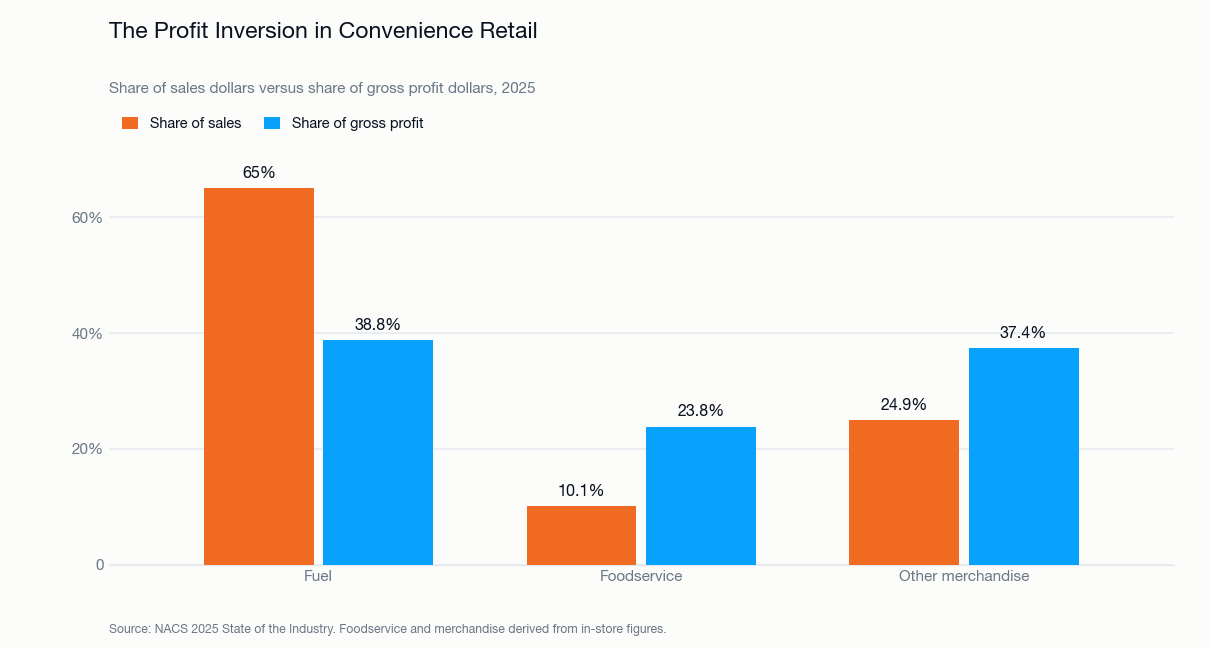
Fuel figures are share of total sales and total gross profit; foodservice and merchandise figures are share of in-store sales and in-store gross profit. Source: NACS 2025 State of the Industry data.
The practical consequence is that two stores with identical total revenue can differ in enterprise value by a factor of two or more. A high-volume fuel site with a minimal food program is, to a strategic buyer, a piece of real estate with a commodity business attached. A moderate-volume site with a mature foodservice program and 35%+ inside gross margin is a platform asset.
2.2 Fuel Margin Dynamics
Fuel margins averaged over 40 cents per gallon in 2025, an historically strong level. This is genuinely good news for current earnings and genuinely complicating for a sale process.
Elevated fuel margins inflate trailing EBITDA. A buyer underwriting a business at the top of a fuel margin cycle will normalize those margins downward toward a long-run average, and the gap between an owner's reported EBITDA and a buyer's underwritten EBITDA is where most transactions in this sector fall apart.
This is the most common valuation dispute in c-store M&A, and it is entirely avoidable with preparation. An owner who presents fuel margin on a normalized basis, with a documented multi-year history and a clear explanation of supply arrangements, controls the narrative. An owner who presents peak-cycle EBITDA and defends it invites the buyer to set the normalization assumption unilaterally.
Section 3: The Operating Environment
3.1 Category Pressure
The nicotine category — historically the traffic and margin backbone of the channel — is in structural decline. The category is projected to fall 4–5% in 2025. Cigarettes, still the largest component, dropped 1.8 share points to 55.7% of nicotine volume (Convenience Store News). Higher state excise taxes, declining smoking rates and regulatory pressure continue to compress the category.
Modern oral nicotine is the offset, projected to grow 35–45% and at better margins. But the transition is not one-for-one: modern oral buyers are a different demographic with different basket behavior, and stores that have not built a compensating foodservice or beverage program are seeing net gross-profit erosion.
For an owner planning an exit, this creates a timing consideration. A business whose gross profit is materially dependent on cigarettes is selling a declining asset, and sophisticated buyers model that decline explicitly.
3.2 The Labor Constraint
Foodservice is the highest-margin opportunity in the channel and the most operationally demanding. It requires food-safety compliance, higher-skilled labor, longer training cycles and materially higher turnover cost than merchandise retailing. Many single-store and small-chain operators have the site quality to support a food program but not the management infrastructure to run one.
This is precisely why strategic buyers pay premiums for sites they can convert: they are buying an unexploited margin opportunity that the current owner cannot access. It is also why an owner who has built a working food program captures a disproportionate share of that value at exit rather than surrendering it to the buyer.
Section 4: Competitive Landscape
4.1 The Consolidators
| Operator | Scale / recent activity | Strategic posture |
|---|---|---|
| Alimentation Couche-Tard (Circle K) | Closed GetGo acquisition, ~270 locations, $1.57B | Aggressive acquirer; withdrew ~$40B Seven & i approach June 2025 |
| 7-Eleven (Seven & i) | Acquired 200 Sunoco stores for ~$1B | Reaffirmed North American IPO plan; targeting 1,300 new NA stores by 2030 |
| Casey's General Stores | Acquired 198 CEFCO stores for $1.15B; now 2,900+ locations | Foodservice-led model; disciplined regional density strategy |
| Sunoco | Sold 200 stores to 7-Eleven; agreed $9.1B Parkland acquisition | Repositioning between retail and wholesale/distribution |
| Murphy USA | Incremental single-site additions | Fuel-led, high-volume, disciplined on price |
| Majors Management | Acquired 35 FTC-mandated Couche-Tard divestitures | Active buyer of divestiture packages |
Sources: C-Store Dive, CSP Daily News.
4.2 What the Divestiture Market Signals
The FTC's requirement that Couche-Tard divest 35 stations as a condition of the GetGo transaction, and Majors Management's acquisition of that package, illustrates a recurring pattern worth understanding. Large platform transactions generate forced-seller inventory in specific geographies, and that inventory clears at prices below what the same assets would command in a competitive process.
For a small operator, this matters in two directions. A nearby divestiture package can temporarily depress local comparable pricing. It can also remove a competitor's expansion path and increase the strategic value of an independent site to the acquirer who lost out.
Timing a sale relative to regional consolidation activity is a genuine value lever, and it is one of the few areas where an advisor with sector-specific deal flow visibility adds measurable value over a generalist.
Section 5: M&A Activity & Deal Flow
5.1 2025 Transaction Overview
| Transaction | Value | Scale | Notes |
|---|---|---|---|
| Sunoco / Parkland | $9.1B | Hundreds of sites | Among the largest sector transactions of 2025 |
| Couche-Tard / GetGo Café + Market | $1.57B | ~270 locations | Closed June 2025; triggered 35-station FTC divestiture |
| Casey's / CEFCO | $1.15B | 198 stores | Pushed Casey's past 2,900 locations |
| Sunoco / 7-Eleven store sale | ~$1B | 200 stores | Portfolio repositioning |
| Couche-Tard / Seven & i (withdrawn) | ~$40B | Global | Withdrawn June 2025 citing lack of constructive engagement |
Sources: C-Store Dive, CSP Daily News.
5.2 Multiples and the Size Gradient
Capstone Partners reports convenience store acquisition multiples averaging 10.1x in year-to-date 2025, with the median store count per transaction falling from 13 in 2024 to eight in 2025 (Capstone Partners).
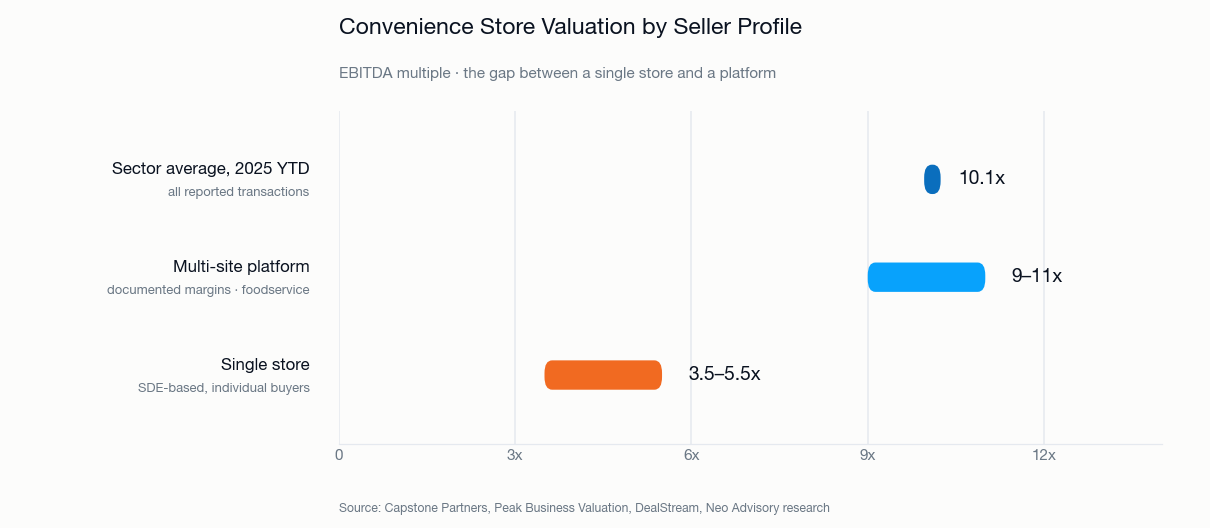
That combination — high multiples, shrinking deal size — is the most important signal in this report. It indicates that buyers with capital and integration capability have moved past the large regional targets and are actively competing for smaller platforms.
| Seller profile | Typical valuation basis | Indicative range |
|---|---|---|
| Single store | Seller's discretionary earnings | ~2.0x–3.5x SDE (≈3.5x–5.5x EBITDA) |
| Small chain, unprepared | Store-level EBITDA, normalized down | Mid single digits |
| Small chain, transaction-ready | Store-level EBITDA | Approaching sector average |
| Sector average, YTD 2025 | Store-level EBITDA | 10.1x |
Single-store ranges from Peak Business Valuation and DealStream; sector average from Capstone Partners. The intermediate tiers are Neo Advisory estimates, presented as such, reflecting the observed spread between published single-store rules of thumb and reported transaction averages.
The spread between the bottom and top of that table is the entire argument for professional sale preparation in this sector. It is not a marginal improvement. On a business with $2 million of store-level EBITDA, the difference between a mid-single-digit outcome and something approaching the sector average is measured in eight figures.
5.3 The Real Estate Question
Convenience retail is unusual in that the operating business and the underlying real estate have separate, deep and differently-priced buyer markets. Getting this structure right is frequently worth more than any operational improvement.
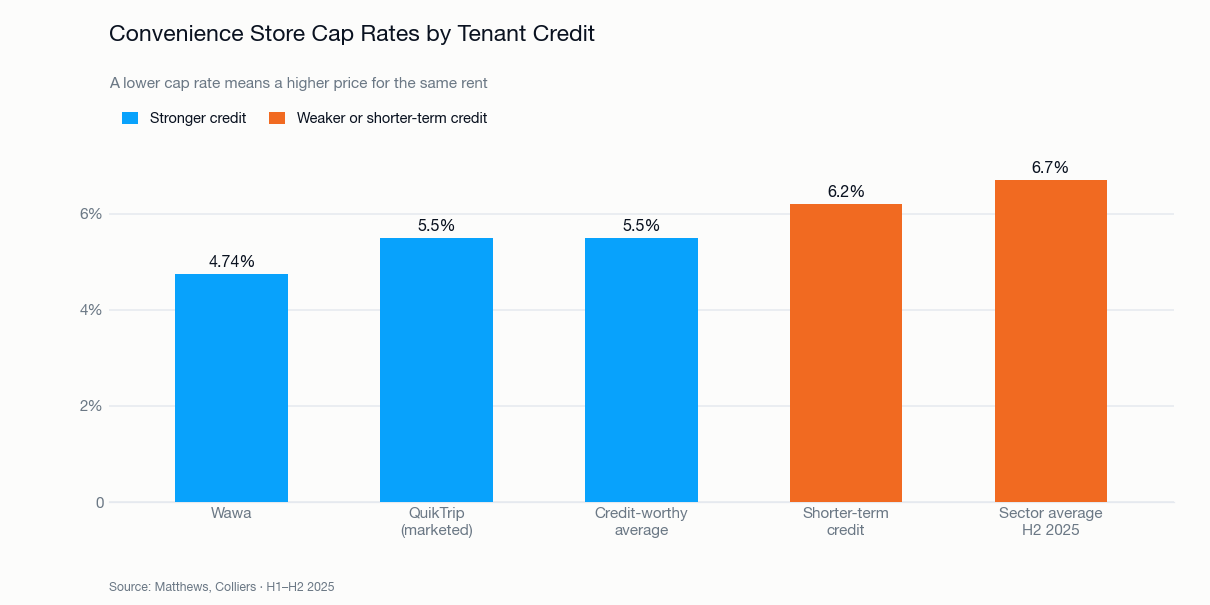
Convenience store cap rates averaged 6.96% in Q1 2025, up 58 basis points year-over-year, before compressing to approximately 6.7% in the second half as transaction volume rose to $6.5 billion (Matthews, Colliers).
Brand credit quality drives enormous dispersion. Wawa-leased properties trade at an average cap rate of 4.74% — the tightest among major brands — while QuikTrip properties have recently marketed between 5.00% and 6.00%. Credit-worthy deals generally trade in the low-to-mid 5% range, with shorter-term credit pushing above 6%.
Two 2025 developments are material for owners:
The permanent reinstatement of 100% bonus depreciation in July 2025 produced an estimated 10–15 basis point compression in absolute NNN gas station cap rates and drove a roughly 20% surge in sector inventory in Q3 (Matthews). Bonus depreciation materially improves after-tax returns for real estate buyers, which increases what they can pay.
Realty Income's $1.5 billion sale-leaseback of convenience store properties from EG Group demonstrated institutional appetite for portfolio-scale c-store real estate at the top of the market.
The practical implication for a small-chain owner is direct. A business with owned real estate that sells as a single combined package is typically valued on the operating multiple, with the real estate absorbed at that lower implied rate. The same business, sold as an operating company to a strategic buyer with a simultaneous sale-leaseback of the property to a net-lease investor at a mid-6% cap, frequently yields a materially higher combined outcome. The arbitrage exists because the two buyer pools price the same asset on different logic — one on operating risk, the other on credit and lease duration.
Capturing that arbitrage requires the real estate to be separable: clean title, no cross collateralization with operating debt, and a lease that a net-lease investor will underwrite. That preparation takes months, not weeks, and cannot be assembled once a process is live.
Section 6: Emerging Trends & Disruptions
6.1 EV Charging: The Capital Expenditure That Is Not Paying Back
The industry consensus on EV charging has shifted decisively and negatively. Executives at Parker's, Sheetz and Nouria have publicly described difficulty justifying continued expansion, citing weakening charging demand, rising installation costs and receding government support (Utility Dive).
Federal funding remains available — the $5 billion NEVI program under the 2021 infrastructure act, with a federal court having lifted the funding freeze — but availability of subsidy is not the same as return on capital.
For an owner considering a sale in the next 24 months, the strategic conclusion is unambiguous: do not undertake discretionary EV charging capital expenditure ahead of a transaction. Buyers are not currently paying for installed charging infrastructure at anything approaching its cost, and the capital is better deployed into foodservice capability, which buyers demonstrably do pay for.
6.2 Foodservice as the Valuation Divide
Foodservice is now the clearest determinant of which end of the multiple range a business occupies. At 28.5% of in-store sales generating 38.9% of in-store gross profit, it is the only category with both scale and expanding margin.
Casey's — which built its entire strategic identity around prepared food, particularly pizza — is the reference case for how foodservice capability translates into acquisition currency and public market valuation.
For a small operator, a credible foodservice program does not require a national brand. It requires a documented product set, consistent execution across sites, food-safety compliance that survives diligence, and a labor model that does not depend on the owner personally. Those four things are what a buyer is checking.
6.3 Scale Economics in Fuel Supply
Fuel supply agreements are a routine source of value leakage that owners rarely price. Branded supply contracts carry volume commitments, term, and change-of-control provisions that can materially constrain a buyer's flexibility — and a buyer who inherits a restrictive agreement will price that constraint into the offer.
Reviewing supply agreements 12 to 24 months before a sale, and where possible renegotiating term or assignment provisions, is among the highest-return preparation activities available. It costs little and can remove a direct deduction from purchase price.
Section 7: 2026 Outlook & Strategic Forecast
7.1 What We Expect
| Indicator | 2025 actual | 2026 outlook | Rationale |
|---|---|---|---|
| In-store sales | $341.2B | Continued modest growth | 23-year streak; foodservice-led |
| Fuel margin | >40 cents/gal | Elevated but normalizing | Cyclical peak; buyers underwriting below spot |
| Nicotine category | −4% to −5% | Continued decline | Structural, partially offset by modern oral |
| Sector M&A multiple | 10.1x YTD | Broadly stable | Strategic buyers remain capitalized and acquisitive |
| Median deal store count | 8 | Stable to lower | Large targets exhausted; buyers working down-market |
| C-store cap rates | ~6.7% H2 | Stable to modestly tighter | Bonus depreciation supportive |
2025 figures as sourced above. 2026 outlook figures are Neo Advisory estimates.
7.2 The M&A Outlook
We expect 2026 to remain an active market for small-chain sellers, for three reasons.
Strategic buyers are capitalized and have publicly stated growth intentions — Seven & i's target of 1,300 new North American stores by 2030 alone implies sustained acquisition and development activity. The failed Couche-Tard/Seven & i combination redirected a substantial acquisition appetite back toward mid-market targets rather than removing it. And the declining median deal size indicates buyers have already worked through the large-target inventory.
Set against this: elevated fuel margins mean sellers are marketing peak-cycle earnings, and any normalization in fuel margin during 2026 will compress reported EBITDA and complicate processes that are mid-flight.
Our view is that the window favors prepared sellers now and becomes less favorable as fuel margins normalize. An owner who intends to transact within three years should be preparing in 2026, not waiting.
7.3 Key Risk Watchpoints
Fuel margin normalization. The single largest risk to seller valuations. A reversion toward long-run averages would compress trailing EBITDA across the sector.
Nicotine acceleration. If category decline steepens beyond 4–5%, stores with high cigarette dependence face compounding gross-profit erosion.
Interest rates and cap rates. C-store cap rates moved 58 basis points in a year. Real estate value is rate-sensitive, and for owners planning an opco/propco separation, rate movement directly affects the propco proceeds.
Antitrust in regional markets. As consolidation continues, FTC scrutiny of regional overlap creates both divestiture supply and process risk for buyers, which can affect the certainty of close.
Neo Advisory's View
Reports of this kind usually stop at description. Below is our position on what the data actually implies for an owner. It draws on the evidence above and on direct conversations with operators and acquirers active in this sector. These are judgments rather than facts, and we have separated them deliberately so a reader can rely on the evidence while disagreeing with the conclusion.
1. Elevated fuel margins are a trap, not a tailwind.
Most owners read a 40-cent fuel margin year as evidence their business is worth more. In practice it is the single most common reason c-store transactions fall apart. Buyers do not underwrite peak-cycle margin; they normalize it toward a long-run average and price accordingly. The seller who walks into a process defending peak EBITDA has already ceded the most important assumption in the model to the other side.
This is also the most consistent theme in what operators tell us after they have been through a process. The strong margin year they expected to be rewarded for became the assumption they spent the negotiation defending.
The owners who transact well do the opposite. They present fuel economics on a normalized basis before the buyer asks, with a multi-year history and a clear account of supply arrangements. This looks like conceding value. It is the opposite: whoever sets the normalization assumption controls roughly a third of the purchase price.
2. The window is open now, and both conditions that opened it are cyclical.
Two things are simultaneously true in this market: buyers are unusually acquisitive, with sector multiples averaging 10.1x and median deal size having fallen from 13 stores to eight as acquirers work down-market; and reported earnings are flattered by historically strong fuel margins.
Neither condition is structural. Fuel margins revert. Acquisition appetite follows capital cycles. An owner waiting for a better moment is implicitly betting that both hold — and they are not independent risks, because a fuel margin reversion would compress reported EBITDA at exactly the moment buyer enthusiasm cools.
Our stance: if an exit is intended within three years, preparation should begin now rather than after the next fuel-margin cycle resolves. We would rather market a business into a strong buyer set with honestly normalized earnings than into a weaker one with peak earnings that no longer exist.
3. Stop selling one business. You have two.
The largest single value lever available to most owners in this sector is not operational — it is structural, and it is routinely left untouched.
An operating business and its underlying real estate are priced by entirely different buyer pools on entirely different logic. A strategic acquirer prices operating risk. A net-lease investor prices credit and lease duration, and at H2 2025 cap rates of roughly 6.7% — tighter still for strong credit — that investor will frequently pay more for the property than the operating buyer implicitly assigns to it inside a combined package.
Selling the two together, to one buyer, means accepting the lower of two prices on half the asset. In our experience this is the most common structural oversight in the sector, and it is rarely a deliberate decision — it is simply how the business has always been held. Capturing the difference requires the real estate to be genuinely separable — clean title, no cross-collateralization with operating debt, and a lease a net-lease investor will underwrite. That is 12 to 24 months of preparatory work and cannot be assembled once a process is live.
4. Do not spend capital on EV charging before a sale.
This is the clearest single recommendation in this report. Executives at Parker's, Sheetz and Nouria have publicly described charging investment as difficult to justify on returns. Buyers are not paying for installed charging infrastructure at anything close to its cost.
The same capital deployed into foodservice capability does get paid for, and demonstrably so: foodservice generates 38.9% of in-store gross profit from 28.5% of in-store sales. If there is discretionary capital to deploy in the 24 months before a sale, it belongs in the kitchen, not the forecourt.
5. Fuel is no longer the asset. It is the traffic driver for the asset.
At 65% of sales dollars and 38.8% of gross profit, fuel has completed a long inversion from profit center to footfall mechanism. Owners who still describe their business by gallons pumped are describing the least valuable thing they own.
The businesses that command the top of the multiple range in 2026 will be those that can demonstrate inside-store gross profit that survives the owner's departure — a documented food program, consistent execution across sites, and a labor model that does not depend on the principal personally. Buyers are checking those four things. Most sellers are not presenting them.
Conclusion
The convenience and fuel retail sector presents an unusual combination for owners considering an exit: a fragmented ownership base with 60% single-store operators, a well-capitalized and demonstrably acquisitive strategic buyer set, sector transaction multiples averaging 10.1x, and a buyer universe that has visibly moved down-market as larger targets have been absorbed.
The gap between what a prepared business achieves and what an unprepared one achieves is wider in this sector than in most, for three specific reasons: fuel margin normalization is a live and quantifiable dispute, foodservice capability creates a genuine bifurcation in buyer interest, and the separability of real estate creates an arbitrage between two differently-priced buyer pools.
None of those three is resolved quickly. Each requires 12 to 24 months of deliberate preparation — normalizing and documenting fuel economics, building foodservice capability that survives owner departure, and structuring the real estate so it can be sold to whoever values it most.
The owners who capture the current market are the ones who started that work before the market was in front of them.
Sources and Methodology
This report synthesizes published industry data with Neo Advisory's own sector coverage. Market sizing, category performance and margin data are drawn from NACS State of the Industry reporting. Transaction data is drawn from company announcements and trade press. Valuation multiple ranges are drawn from the sources cited; where we have presented an intermediate estimate, it is identified as a Neo Advisory estimate in the accompanying note.
- NACS — U.S. Convenience In-Store Sales Top $340 Billion: in-store sales, fuel and foodservice gross profit share, fuel margins, store counts.
- Capstone Partners — Convenience Store Acquisitions Update: sector transaction multiples, median deal store count, single-store operator share.
- C-Store Dive — Tracking c-store acquisitions across the industry: 2025 transaction detail.
- CSP Daily News — 4 of the biggest M&A moves in convenience in 2025 and Convenience Store Valuations Drift Higher.
- Matthews — C-Store Market Report 2025 and 2025 Cap Rate Recap: cap rates, brand-level dispersion, bonus depreciation effects.
- Colliers — Single-Tenant Net Lease Retail: Second Half 2025 Market Review: net lease volumes and cap rate movement.
- Convenience Store News — Modern Oral Drives Growth in Declining Nicotine Market: nicotine category performance.
- Utility Dive — Convenience store executives say EV charging investments not paying off: EV charging economics.
- Peak Business Valuation — Convenience Store Valuation Multiples and DealStream — Convenience Store Rules of Thumb: single-store valuation ranges.
Prepared by John-Michael Tamburro, Founder, Neo Advisory.
The views expressed in the Neo Advisory's View section are our own, and reflect direct conversations with operators and acquirers active in the sector alongside the published data cited above.
This report is prepared for informational and publication purposes only. It does not constitute investment or financial advice. All figures are estimates and subject to revision, and forward-looking projections are inherently uncertain.